> ## Documentation Index
> Fetch the complete documentation index at: https://docs.amberdata.io/llms.txt
> Use this file to discover all available pages before exploring further.
# Getting Started
> Learn the basics of creating and adding a custom insight to your first dashboard.
This guide explains various ways in which you can create and manage custom dashboards inside Amberdata Intelligence.
***
## **Create an Insight and Add to a new Dashboard**
1. Once you have an insight from Data Weaver that you want to save, click on the *Pin* button in the top right corner.
2. This will open an additional menu, where you'll see the list of available dashboards. Your menu may look one of two ways depending on whether you have or have not previously created a dashboard.
### No Previous Dashboards Exist
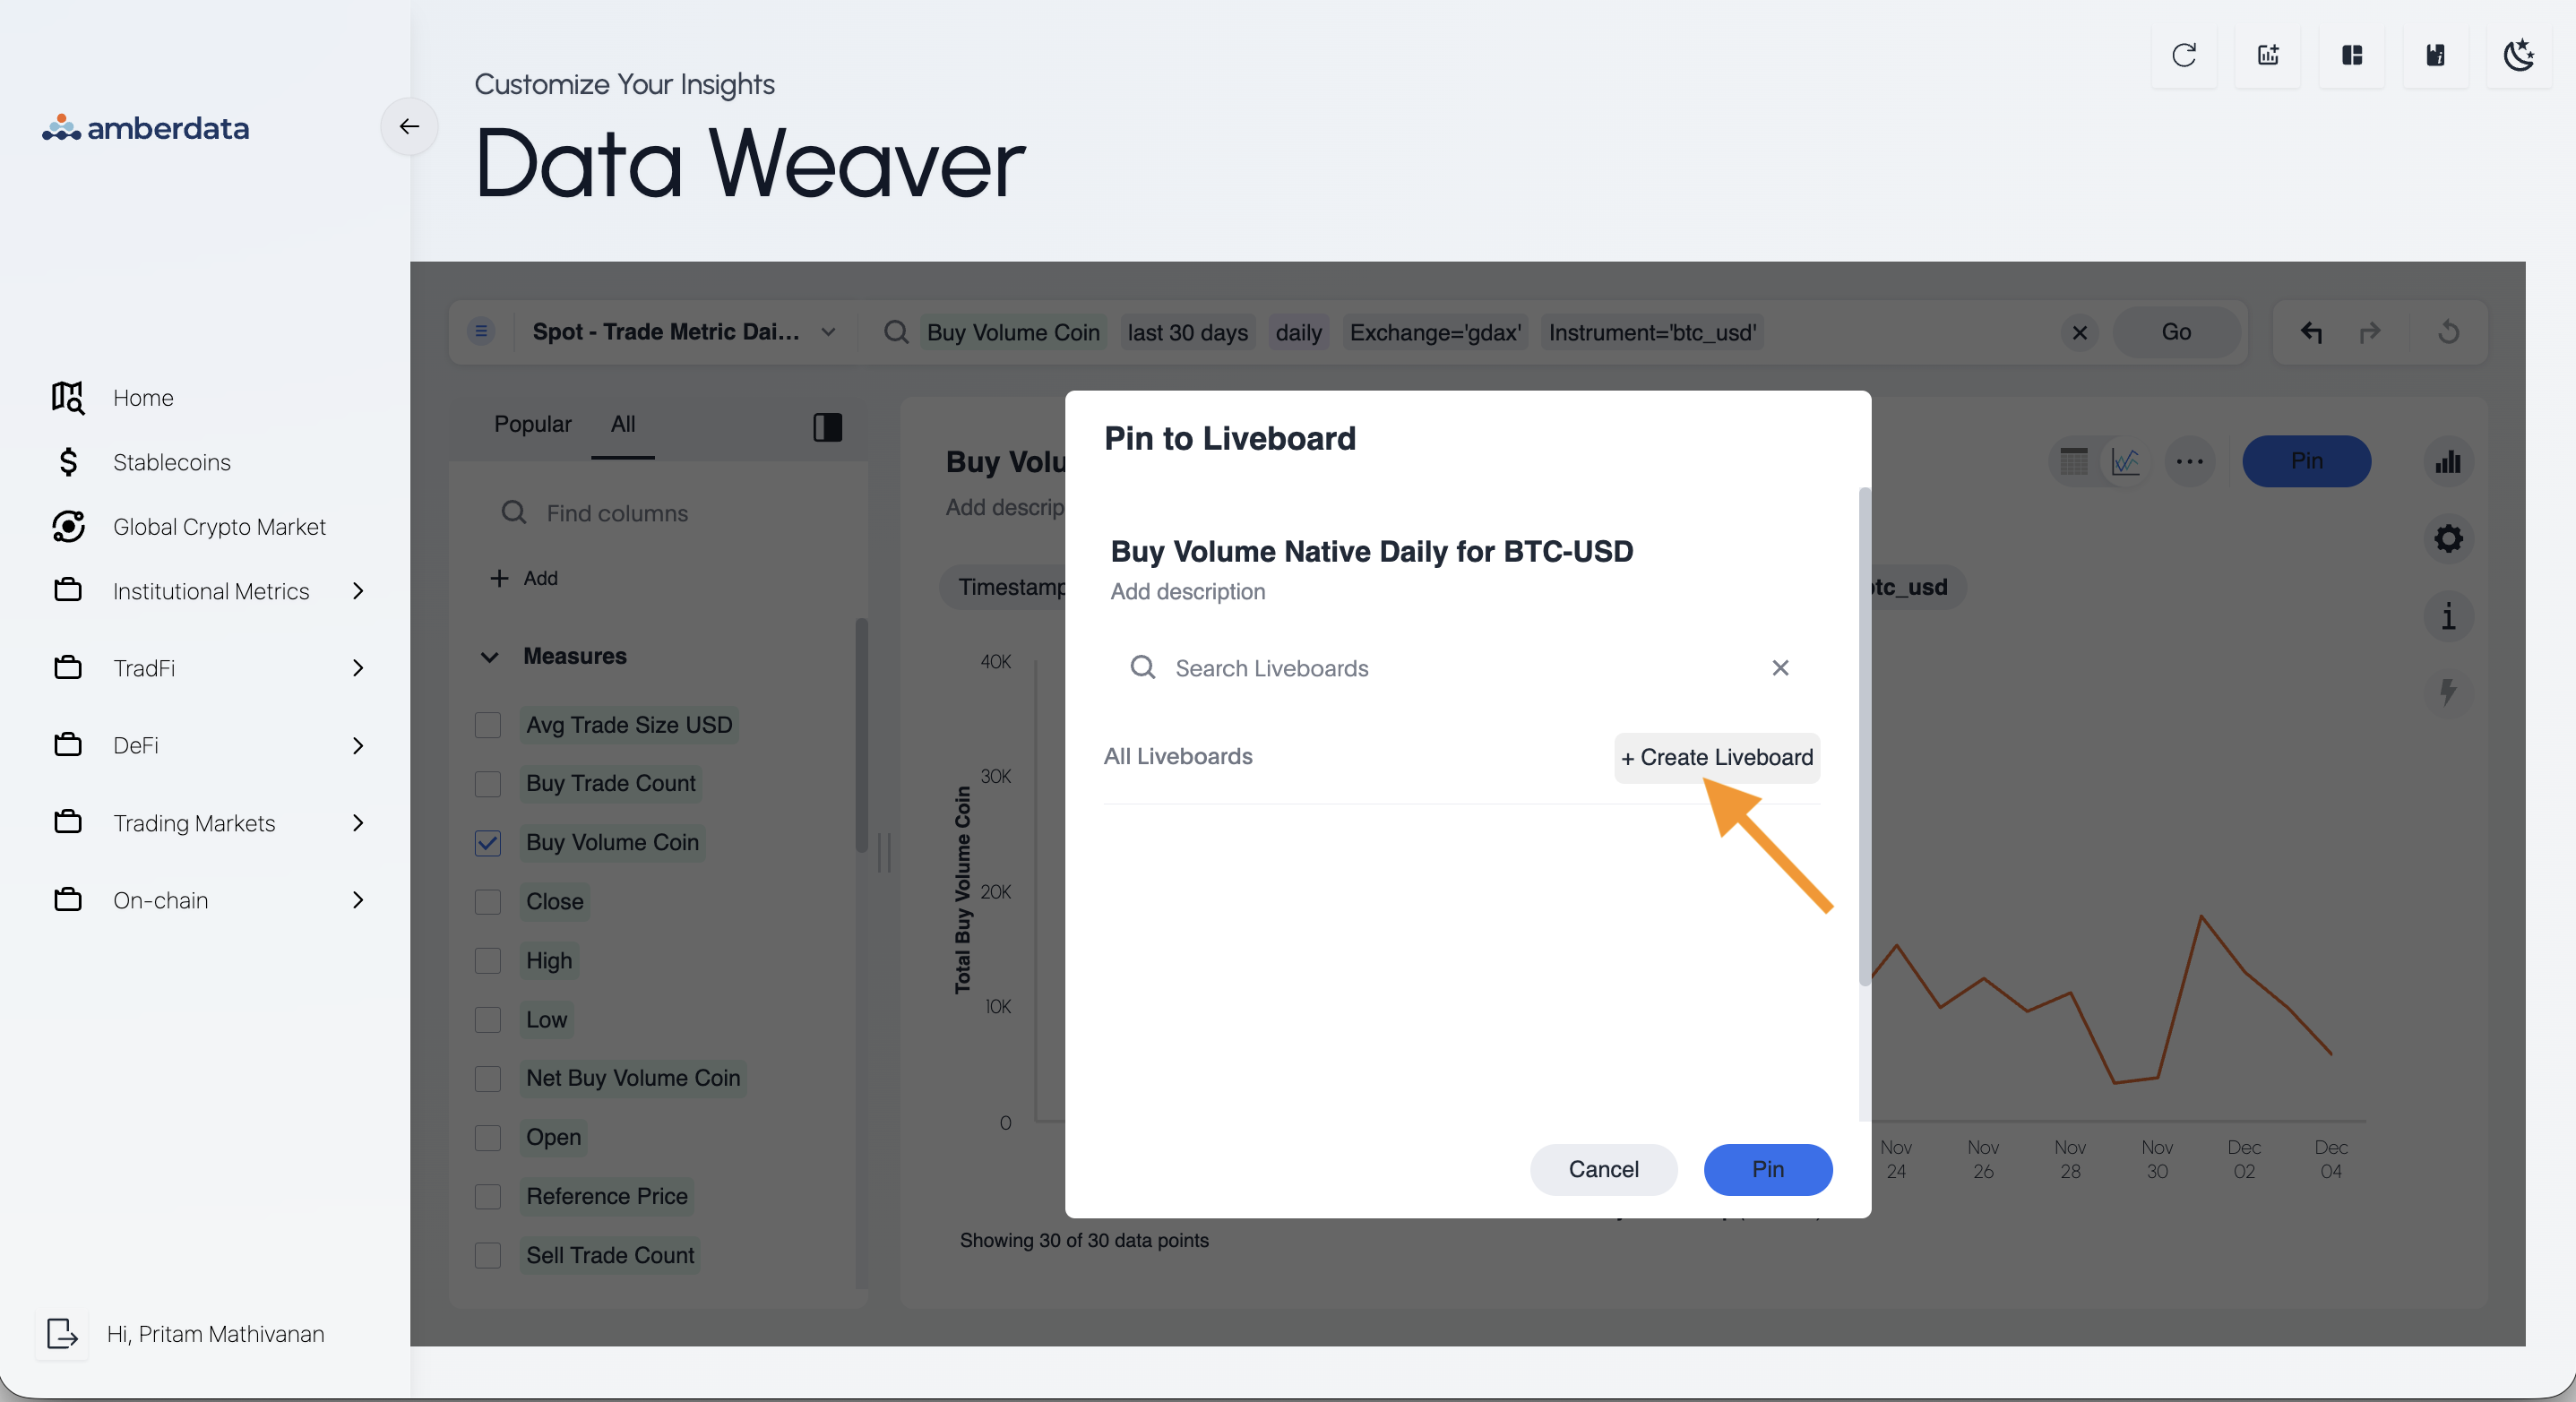
1. If you have no dashboards available, click on the *Create Liveboard* button, which will create an empty text section for you to type in your dashboard name
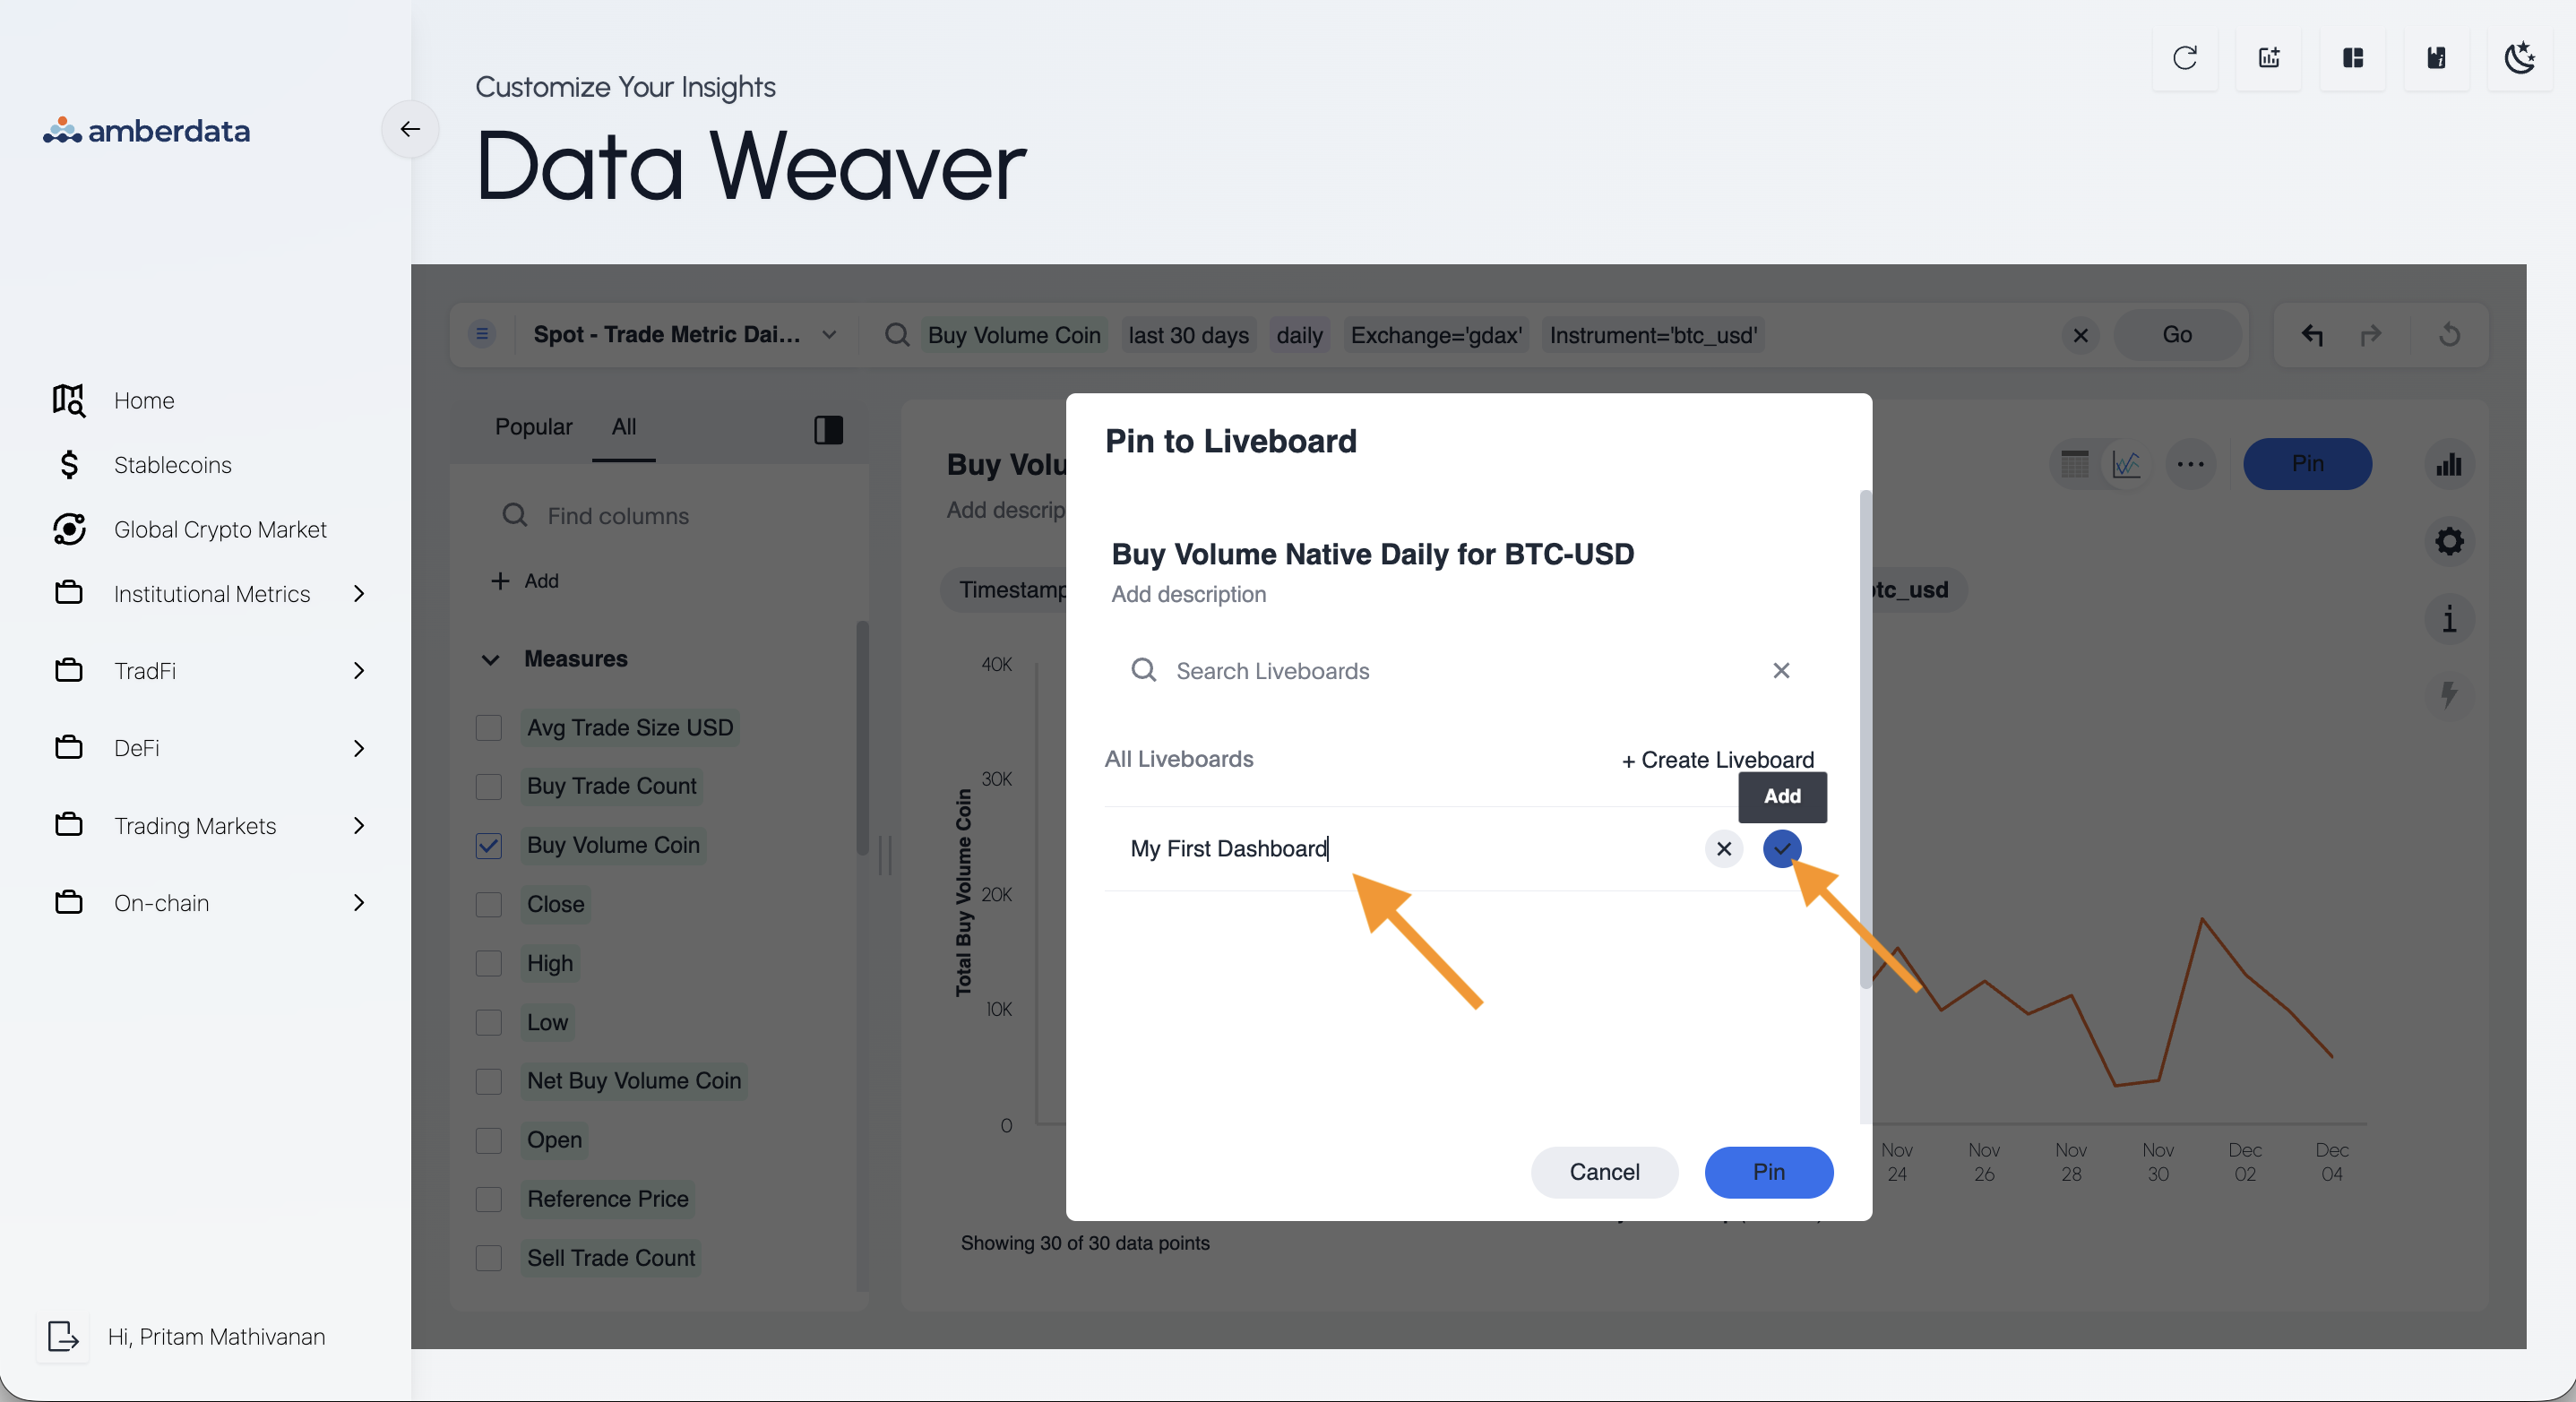
 2. Once you have a name for your dashboard, click on the blue check to the right of the name to save it
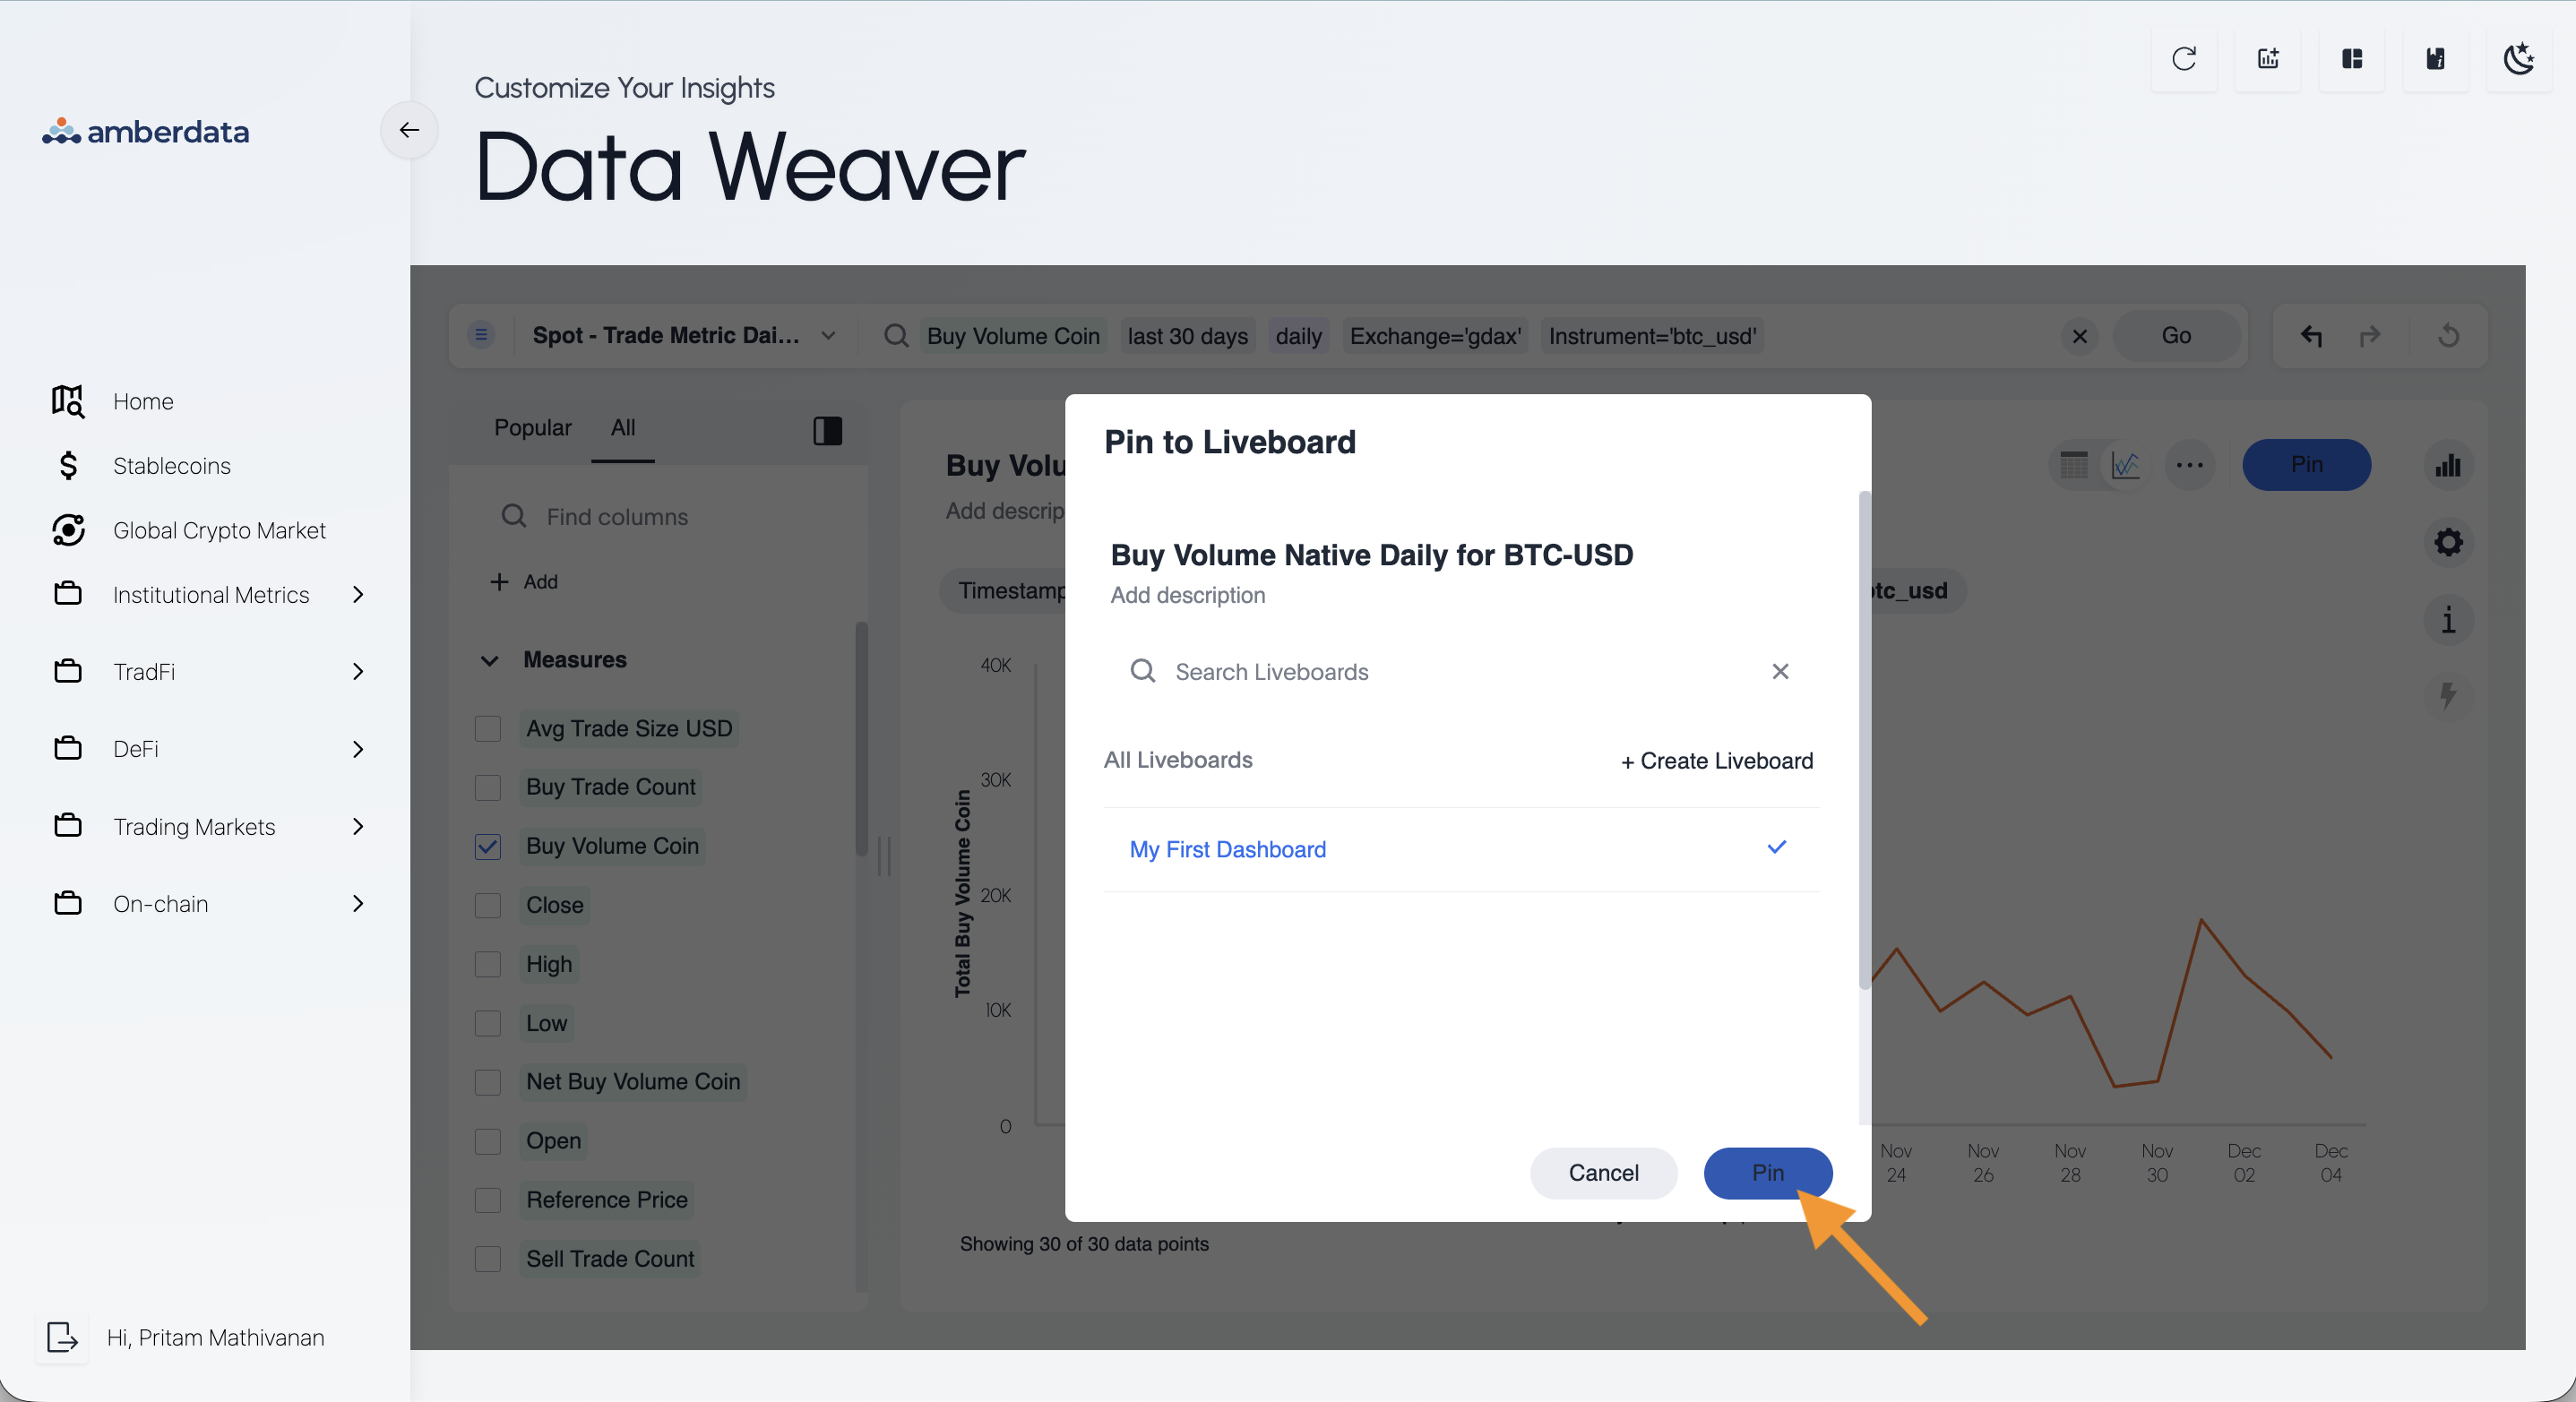
 3. And to finish saving the insight to the newly created dashboard, click on the *Pin* button at the bottom of the menu
 ### Some Previous Dashboards Exist
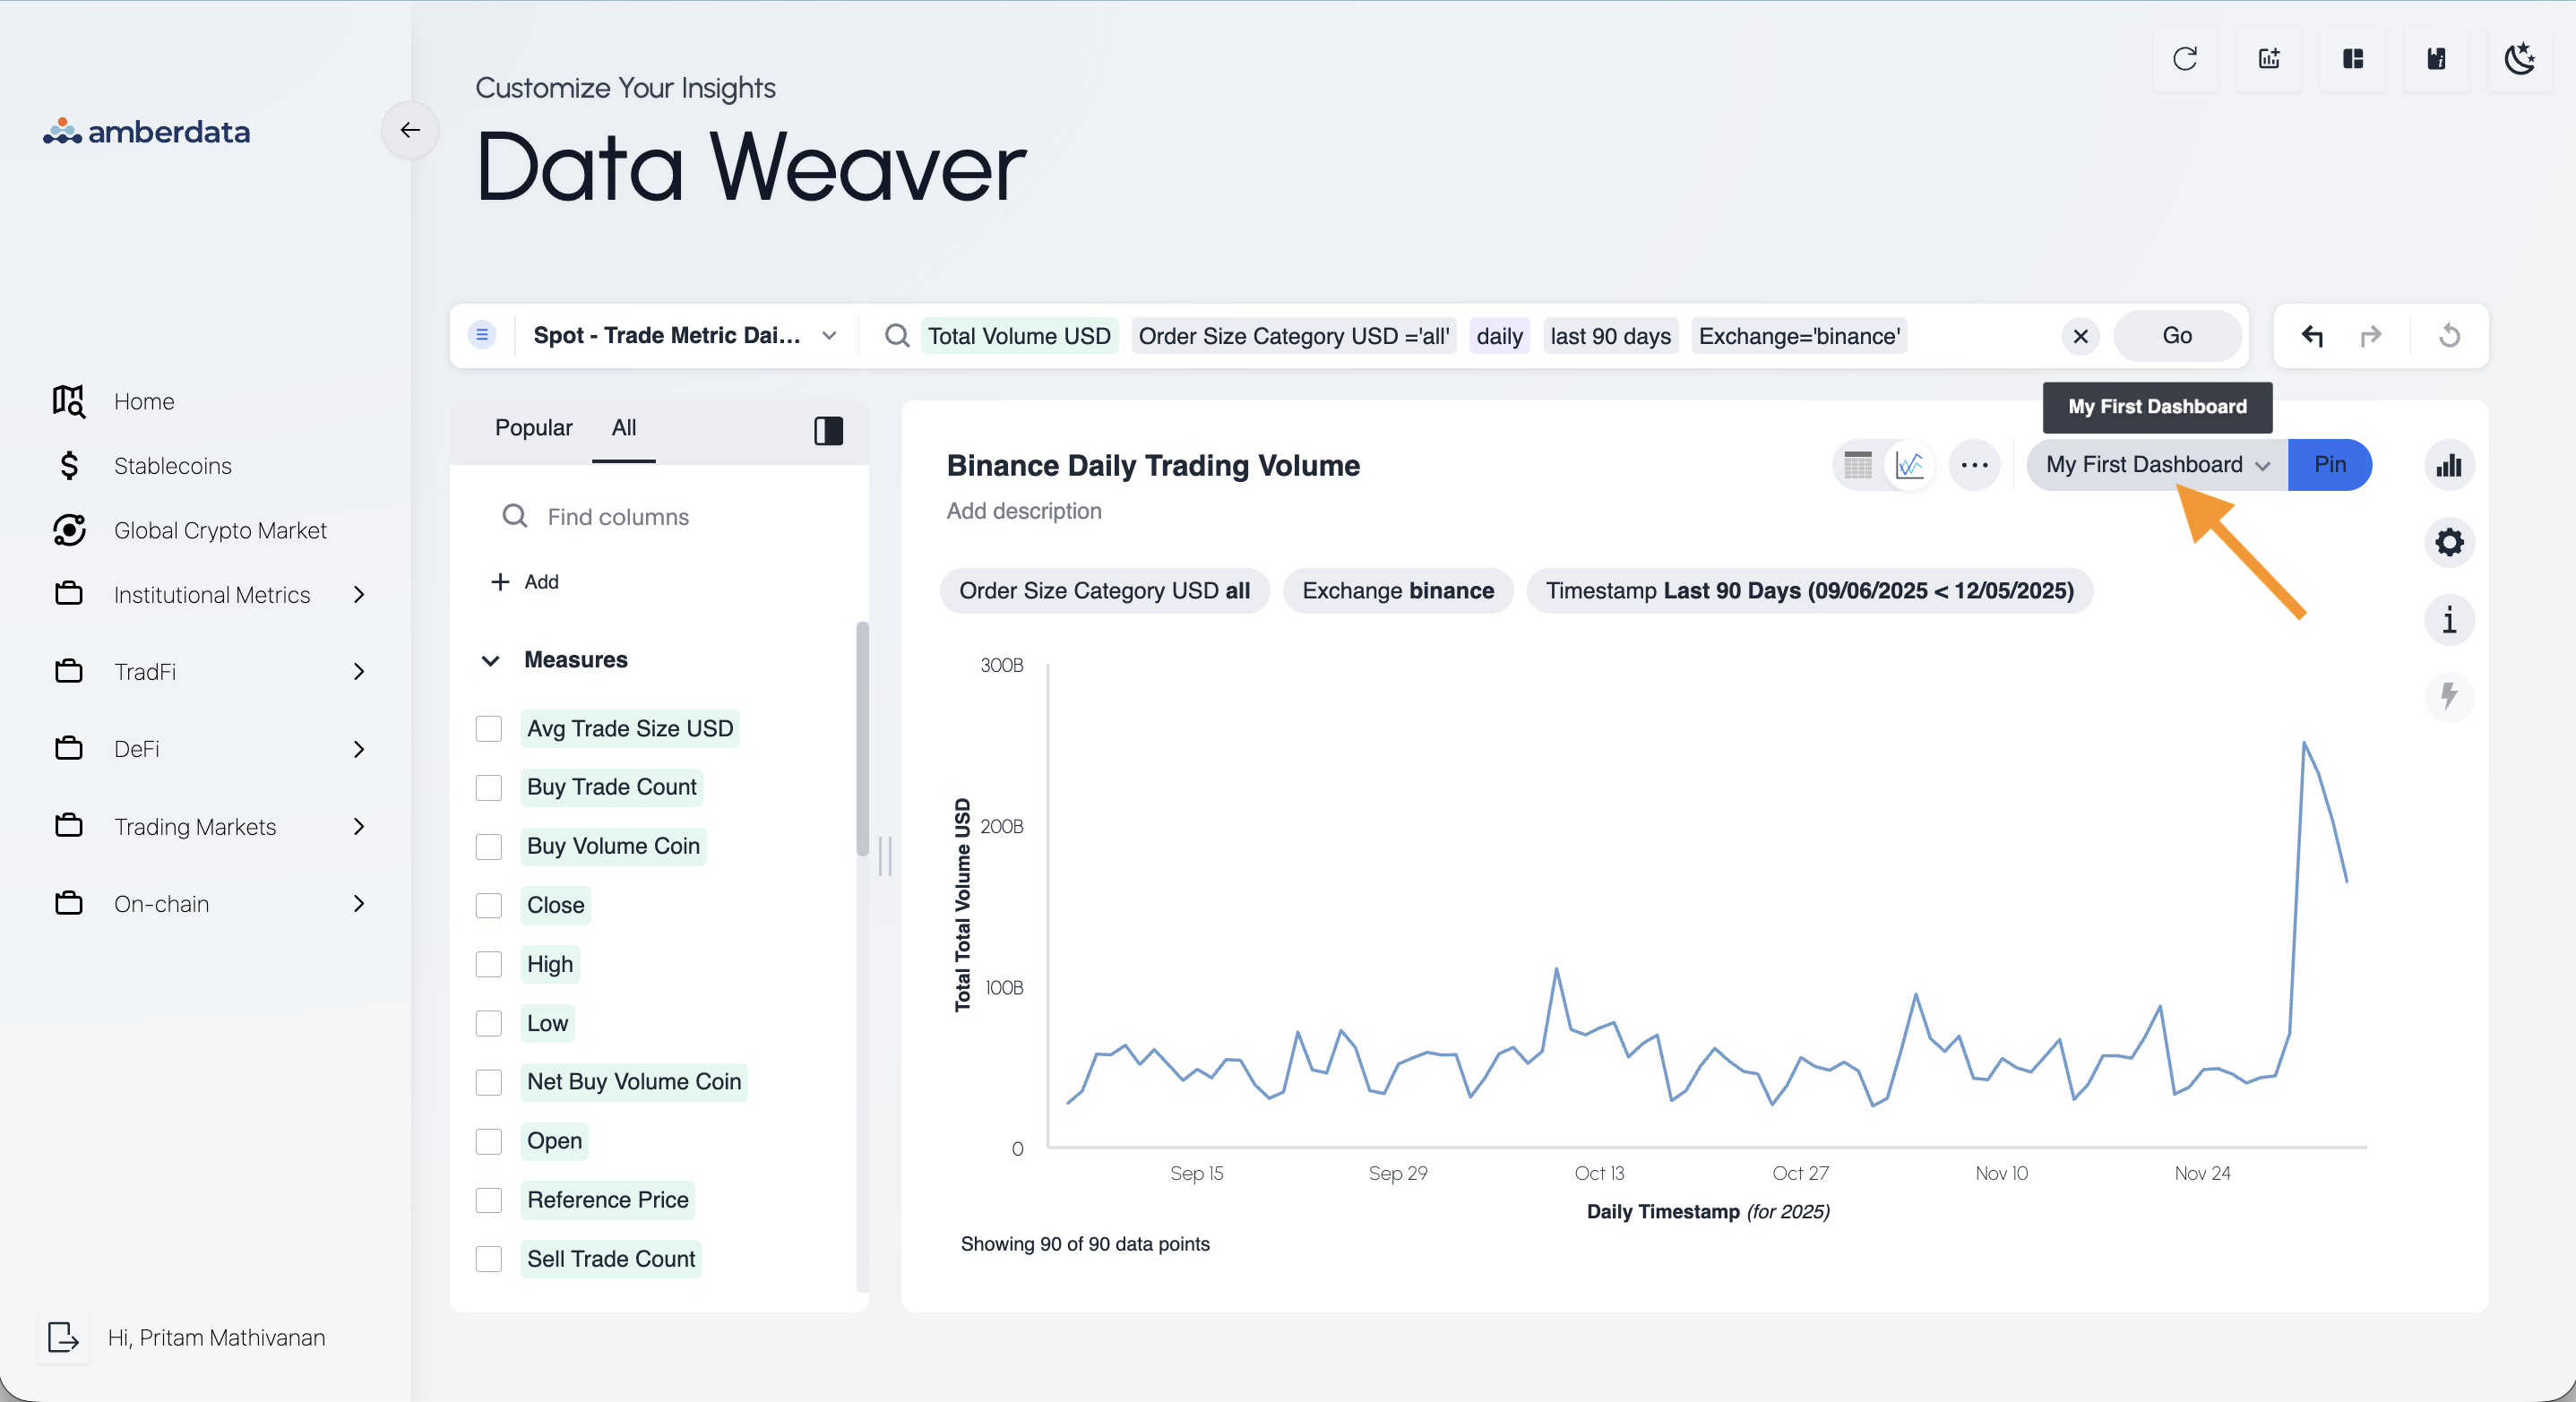
1. If you already have existing dashboards, click on the dropdown menu just left of the *Pin* button
### Some Previous Dashboards Exist
1. If you already have existing dashboards, click on the dropdown menu just left of the *Pin* button
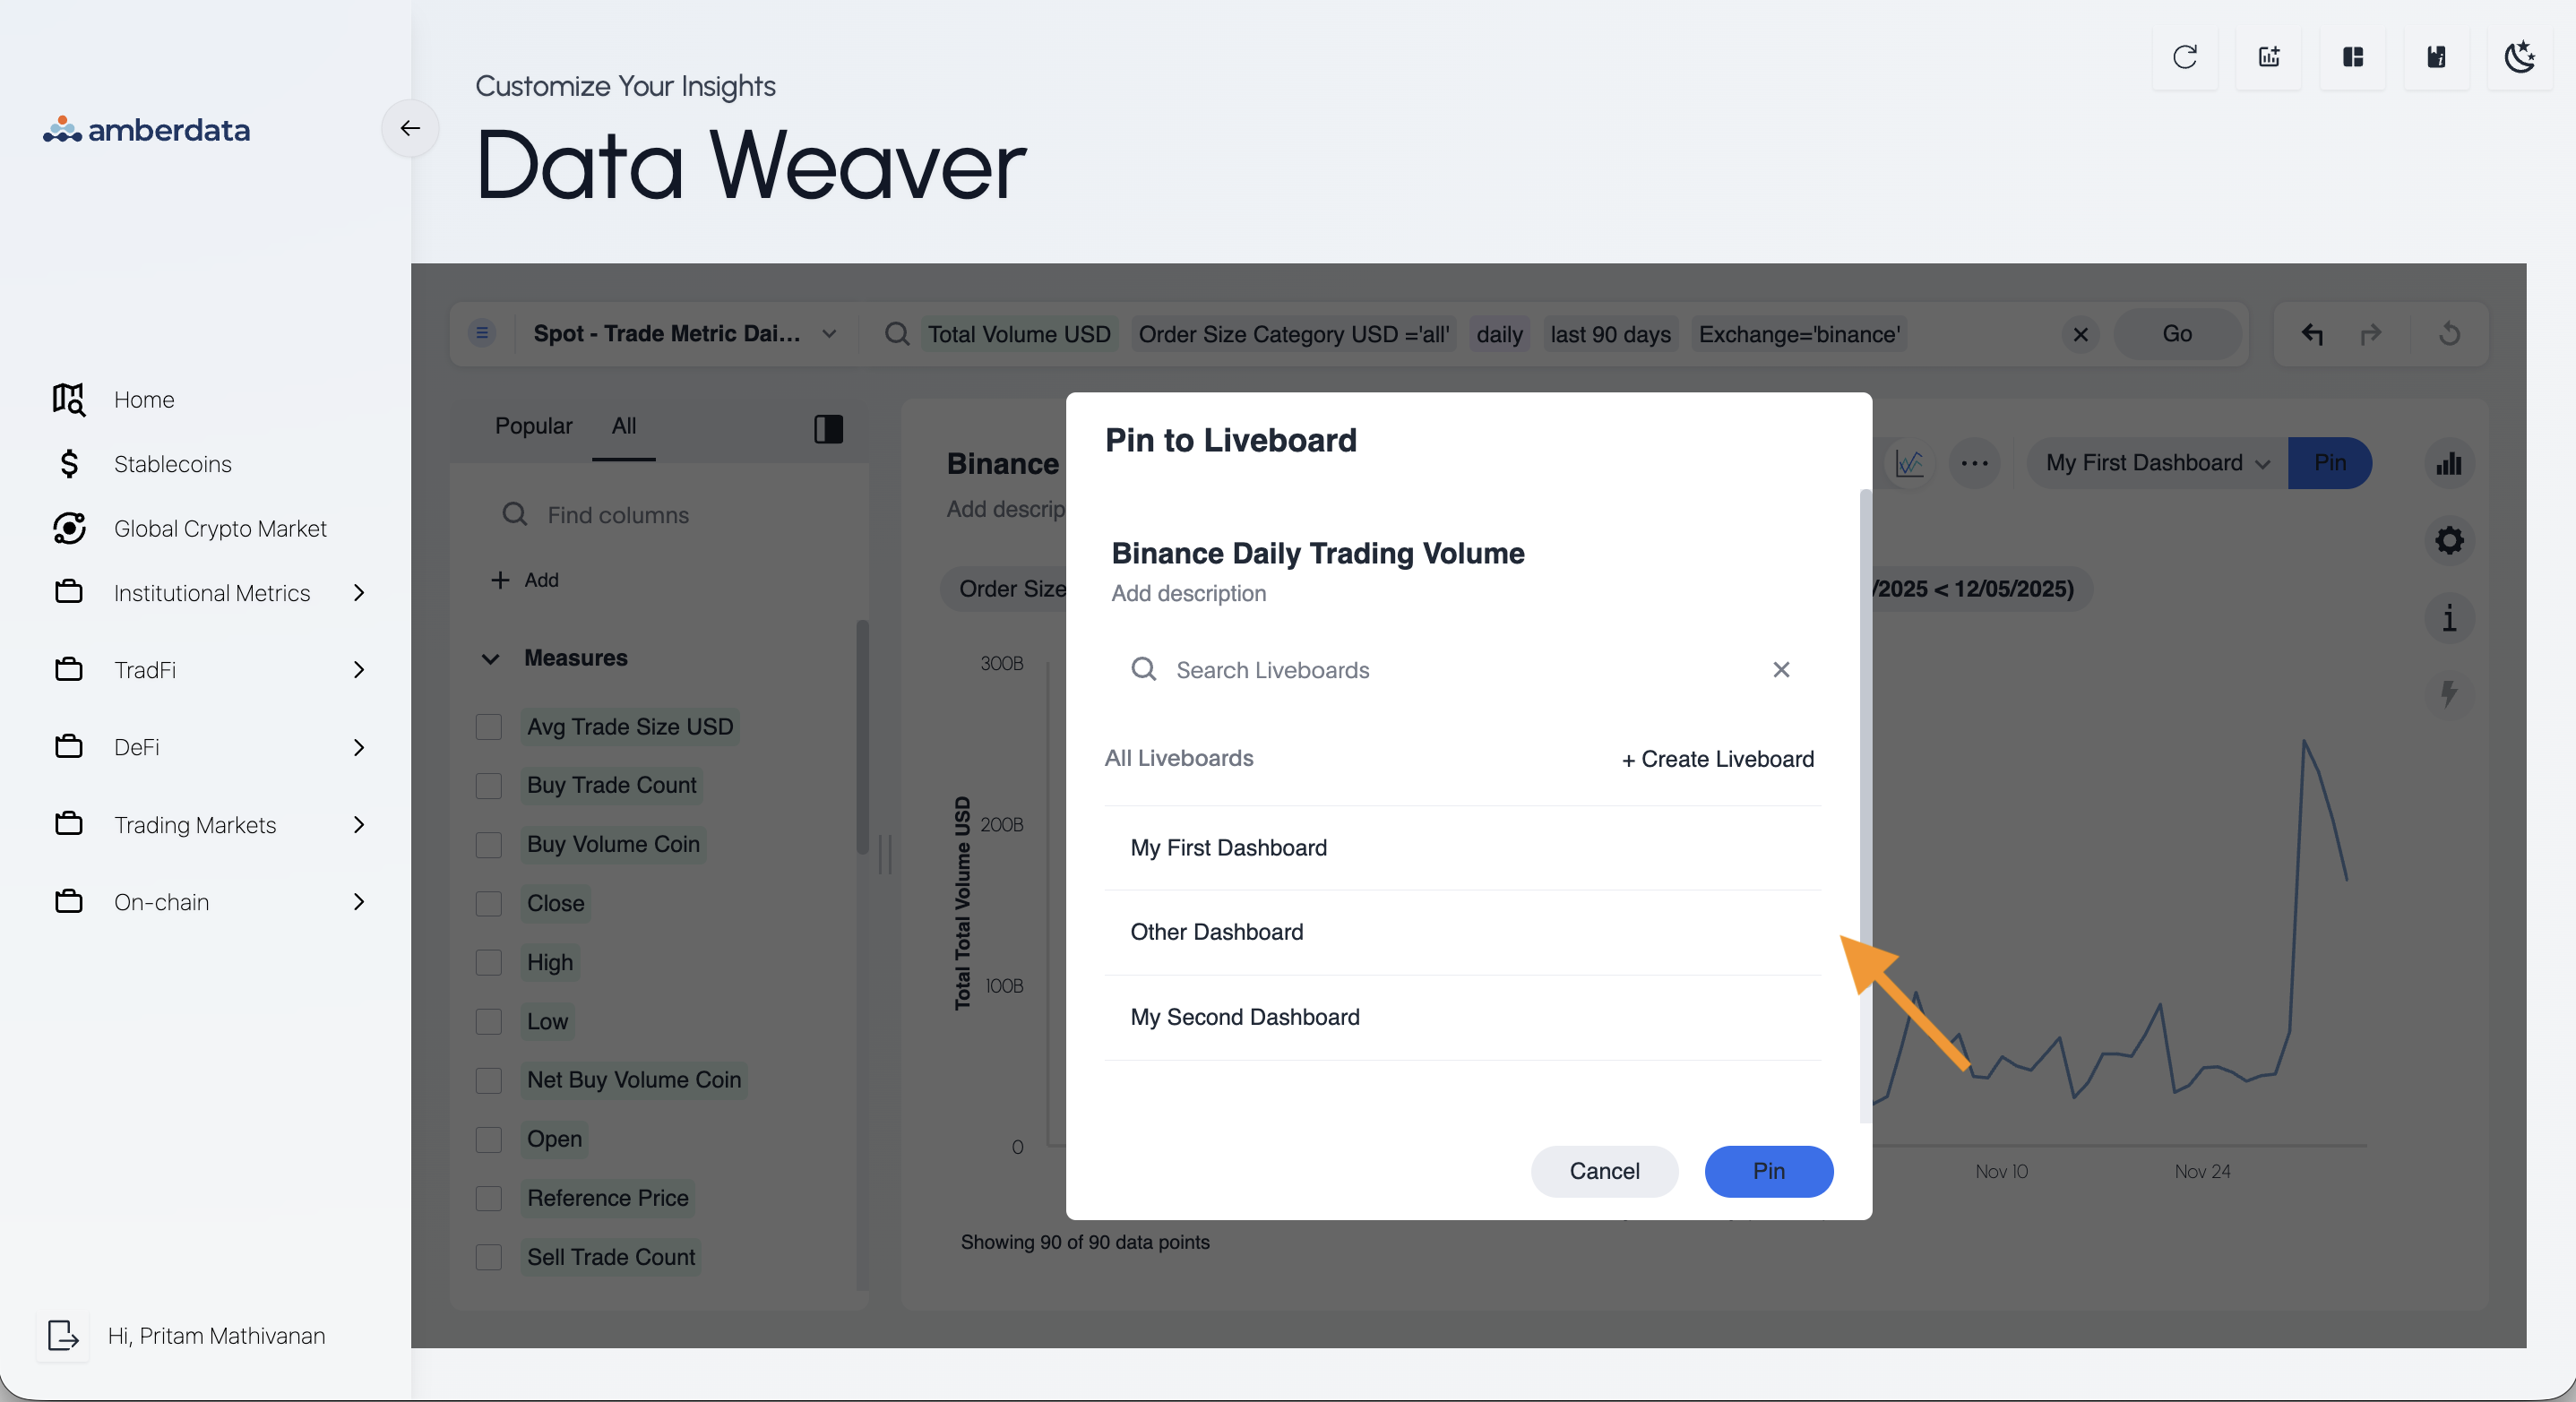
 2. You'll see the list of your available dashboards, click to choose which dashboard you want to save the insight to. When selected, a checkmark will appear to the right of the dashboard name
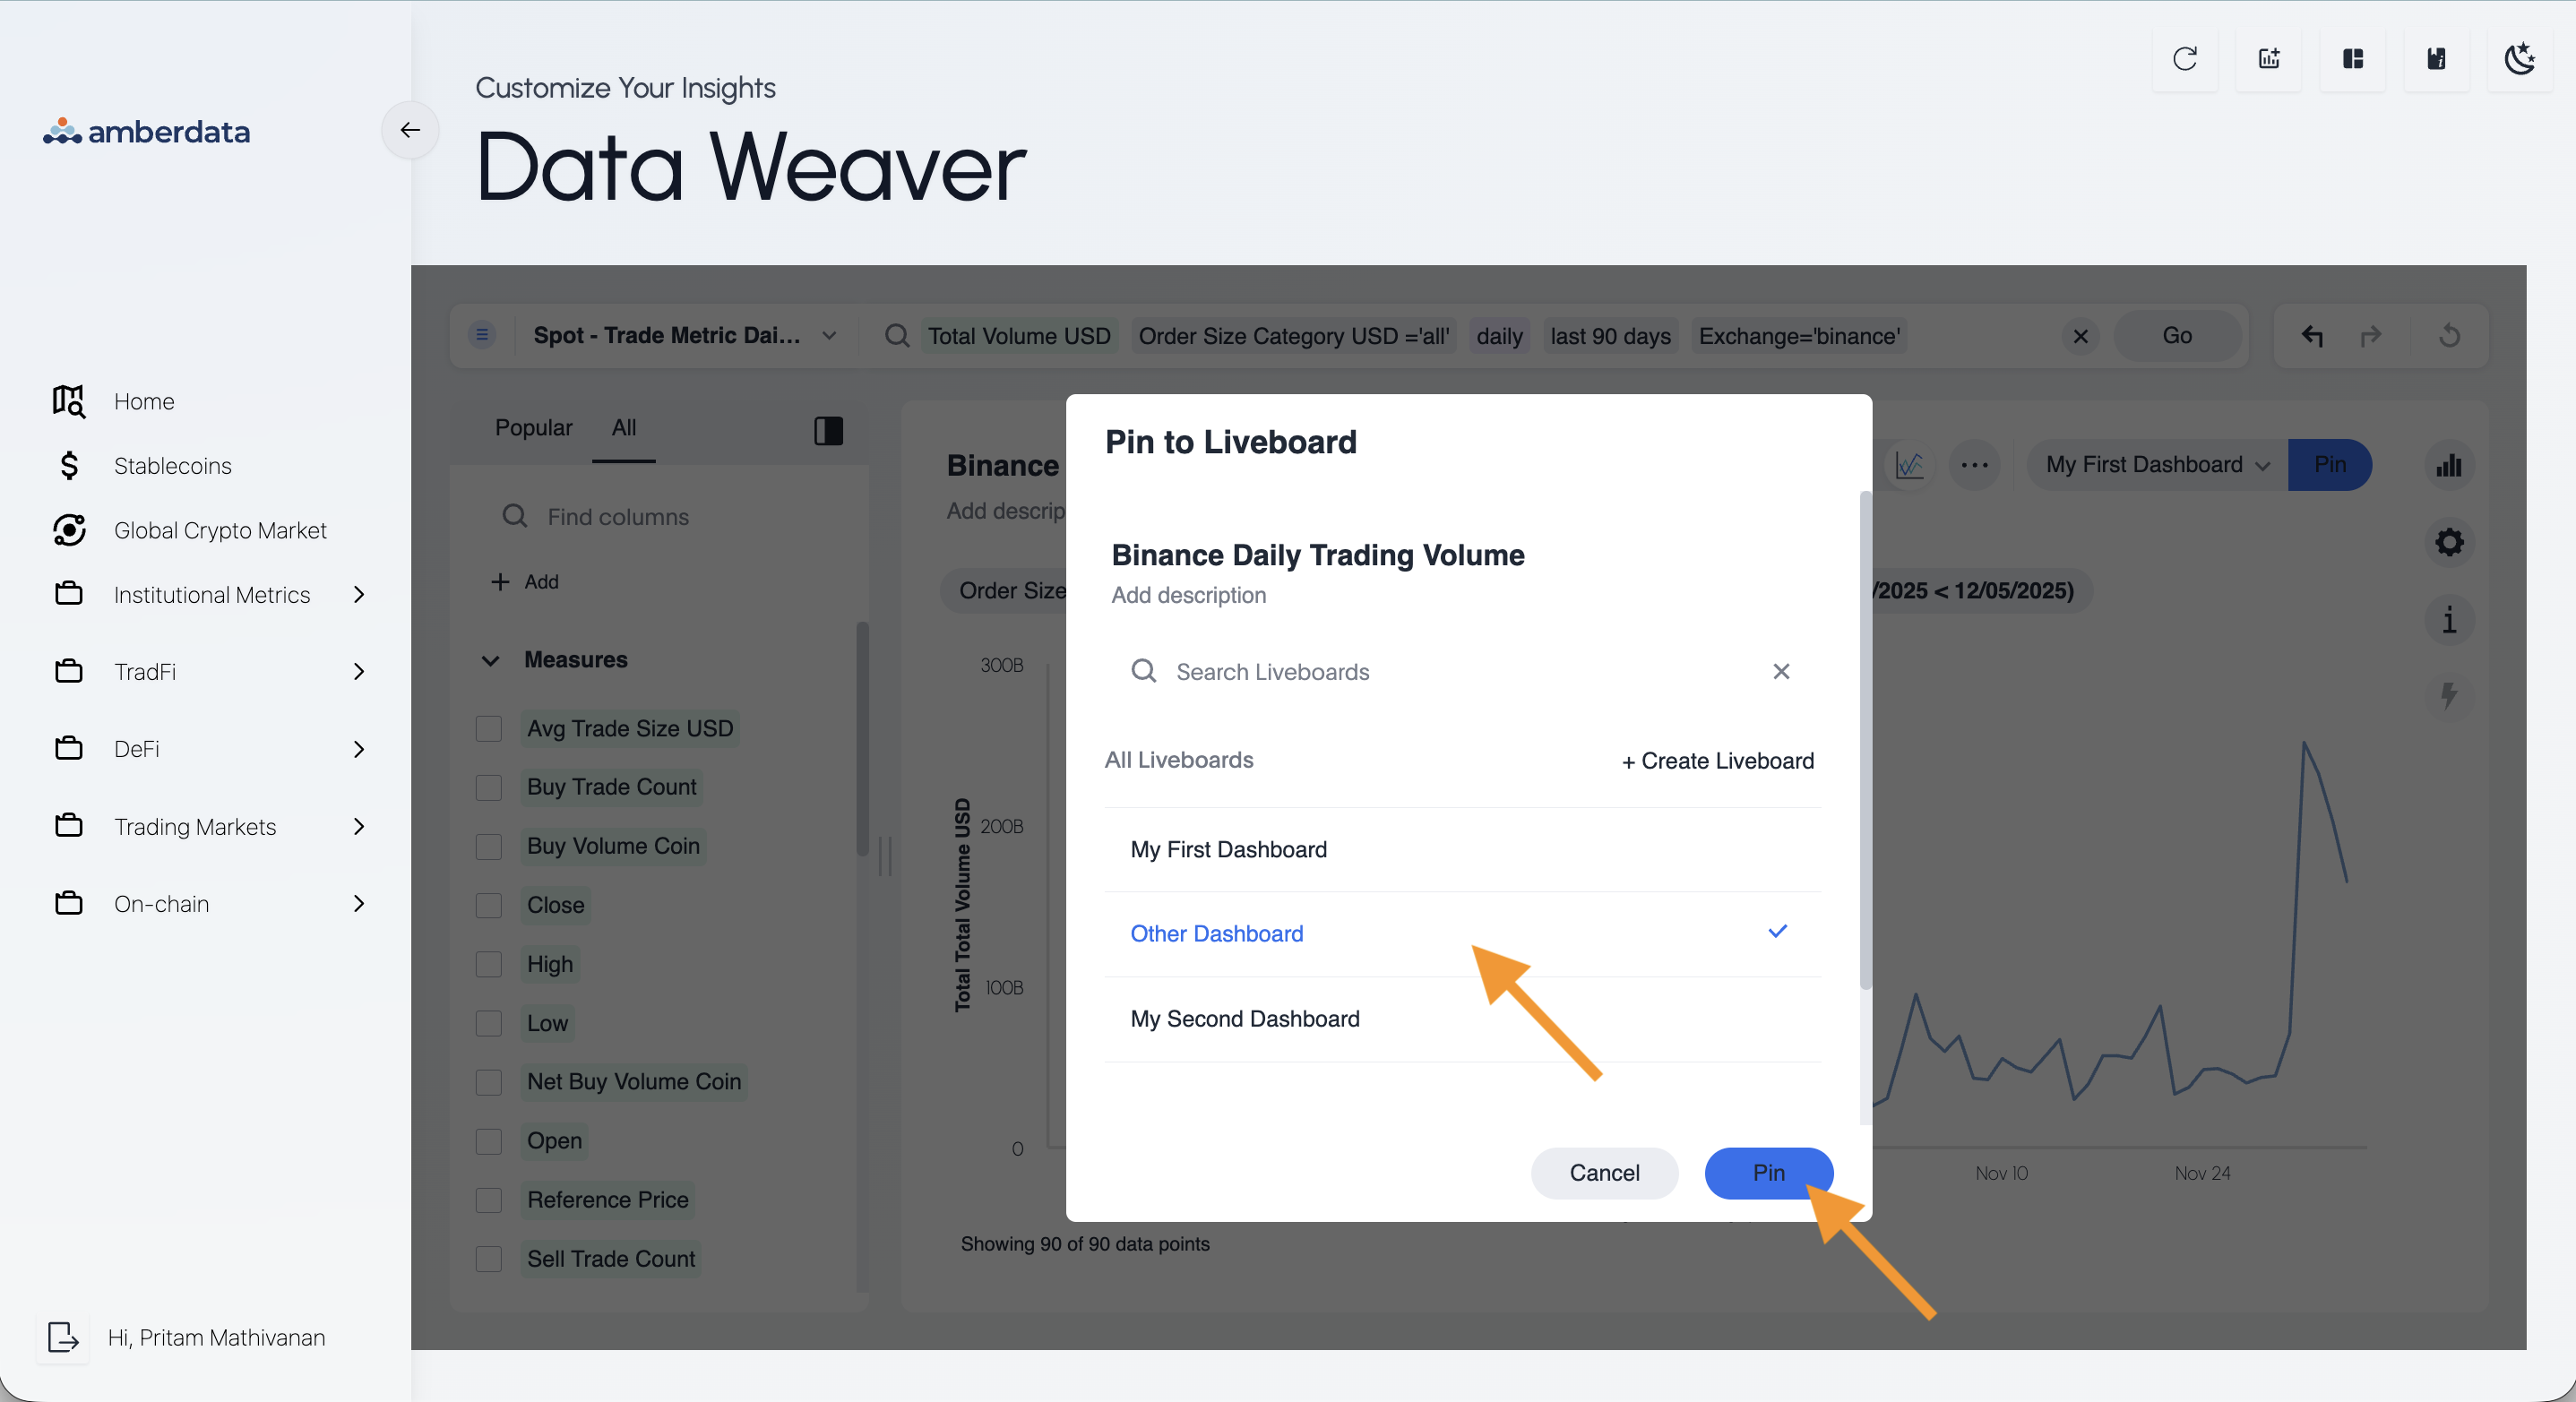
 3. And to finish saving the insight to the selected dashboard, click on *Pin* in the bottom right
 ## **Navigate to Your Dashboards**
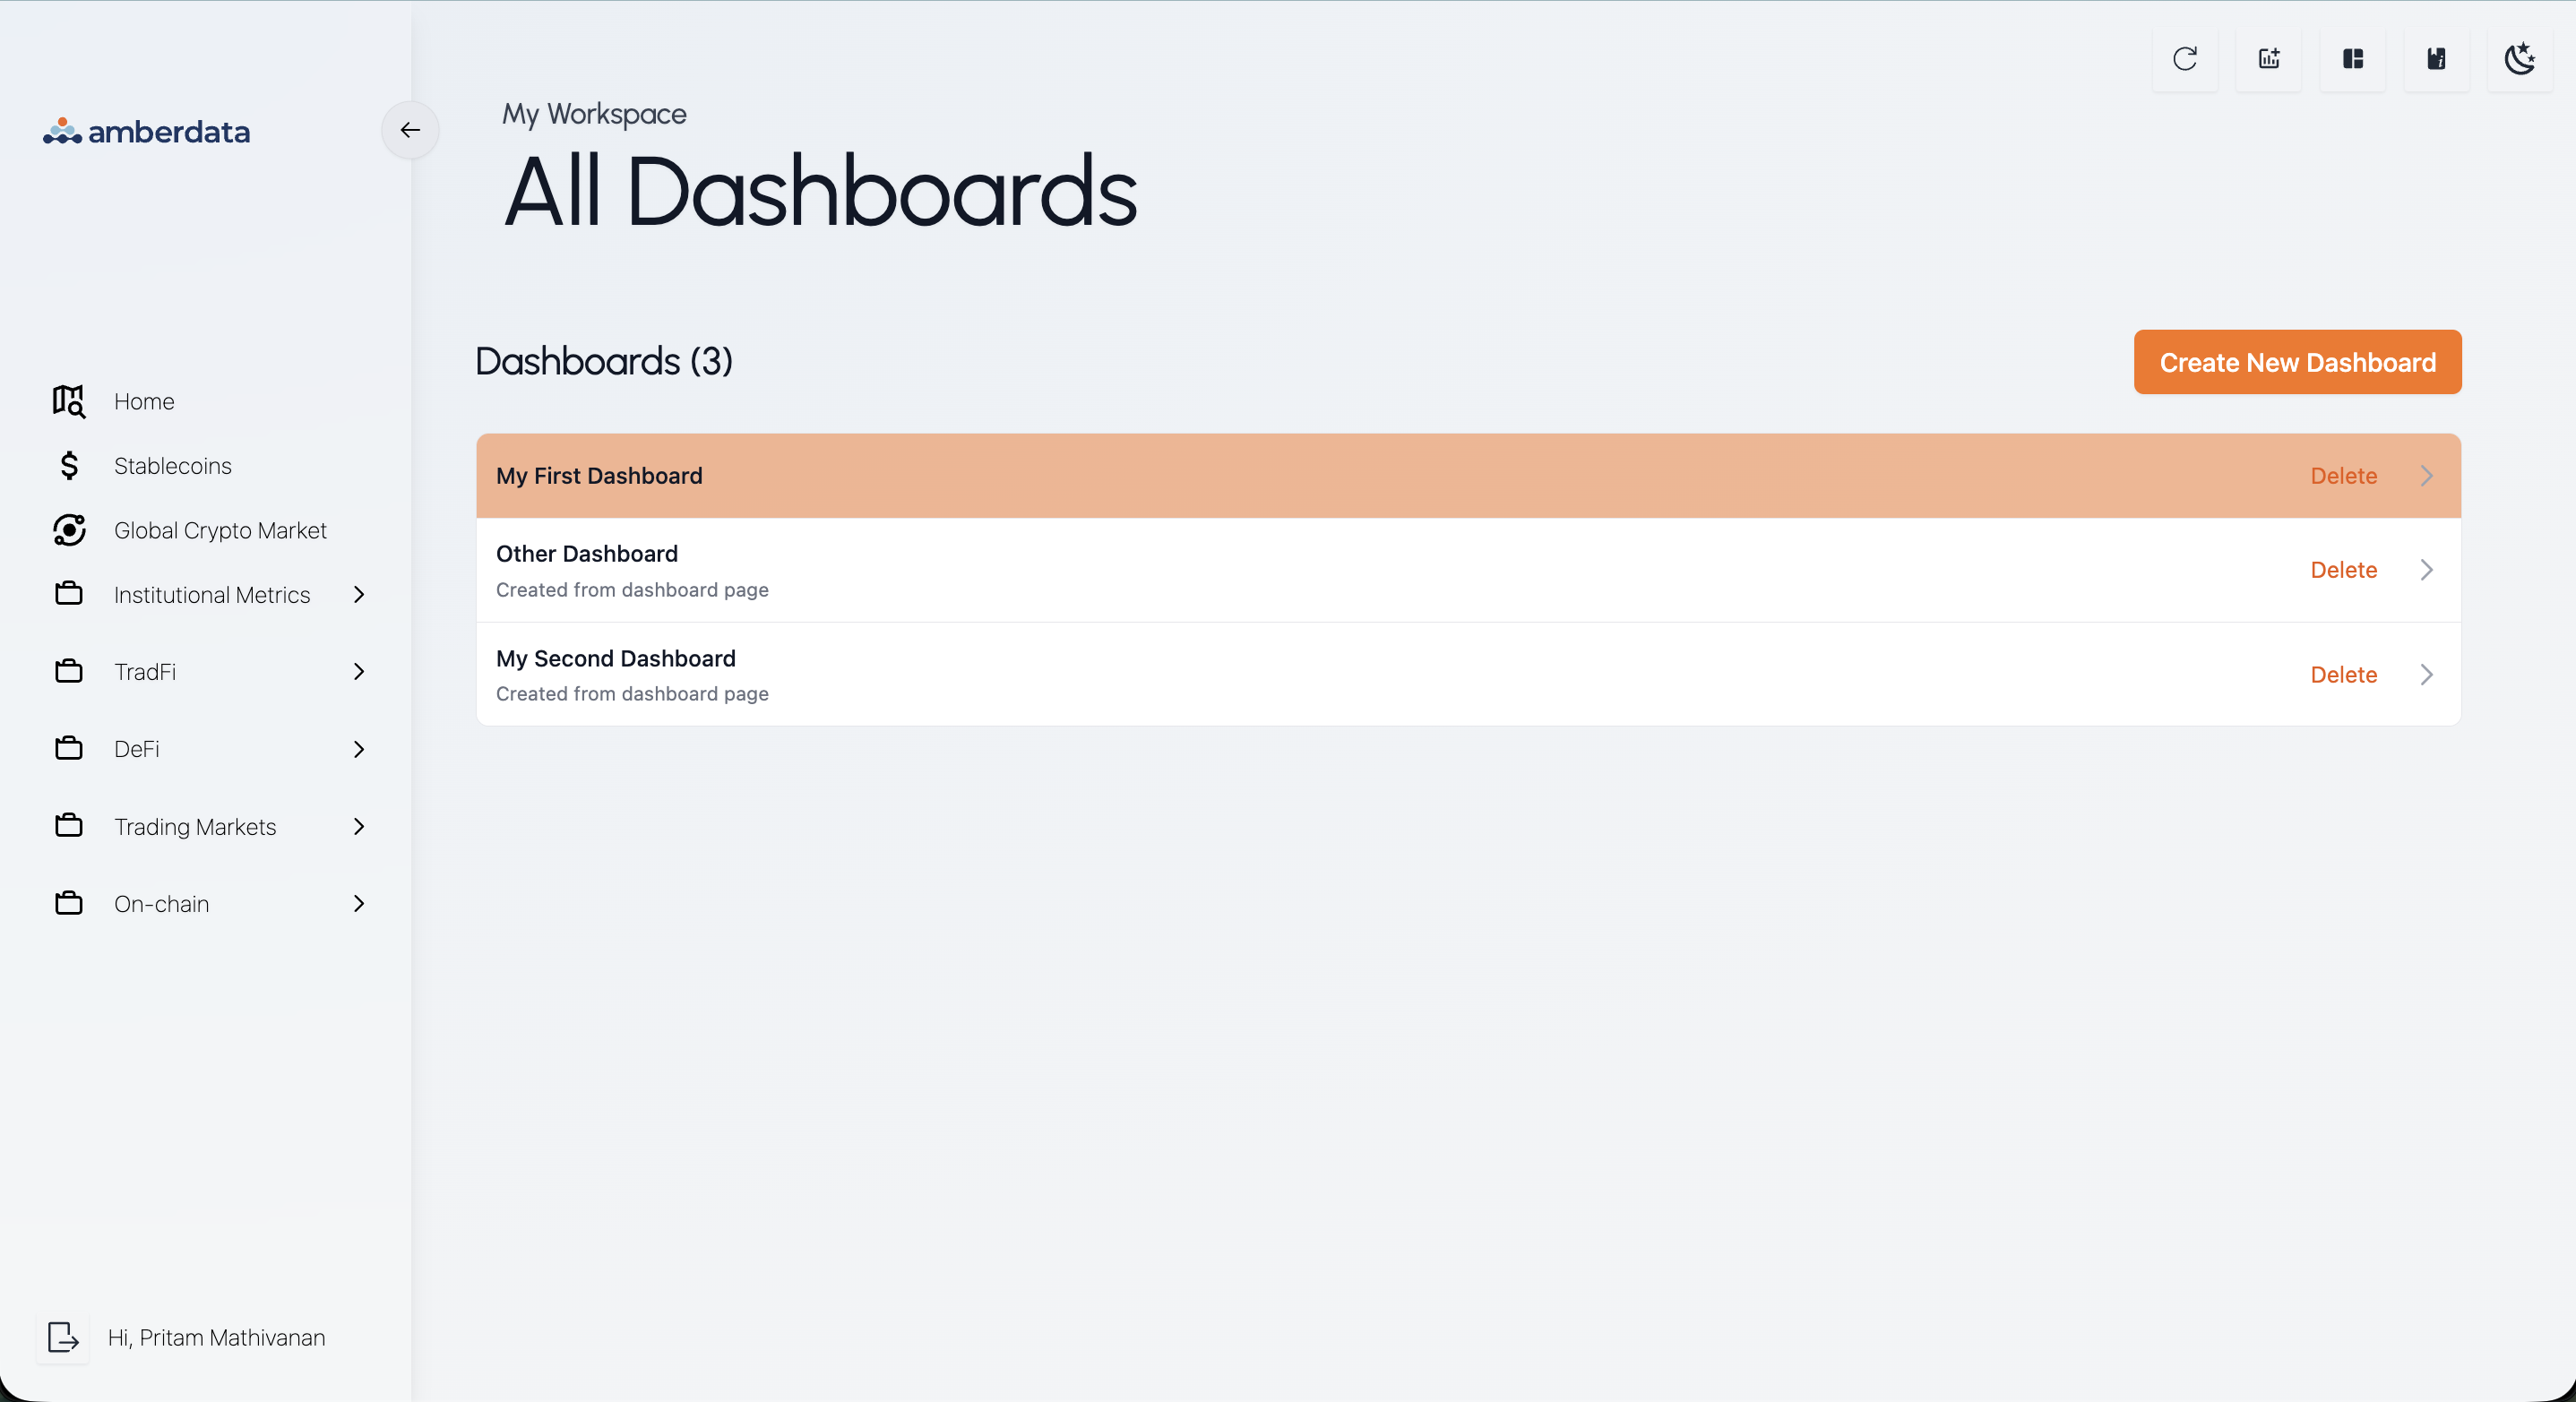
1. In the top right, click on the *Dashboard Gallery* button, this will take you to a new screen where you will see your complete list of dashboards
## **Navigate to Your Dashboards**
1. In the top right, click on the *Dashboard Gallery* button, this will take you to a new screen where you will see your complete list of dashboards
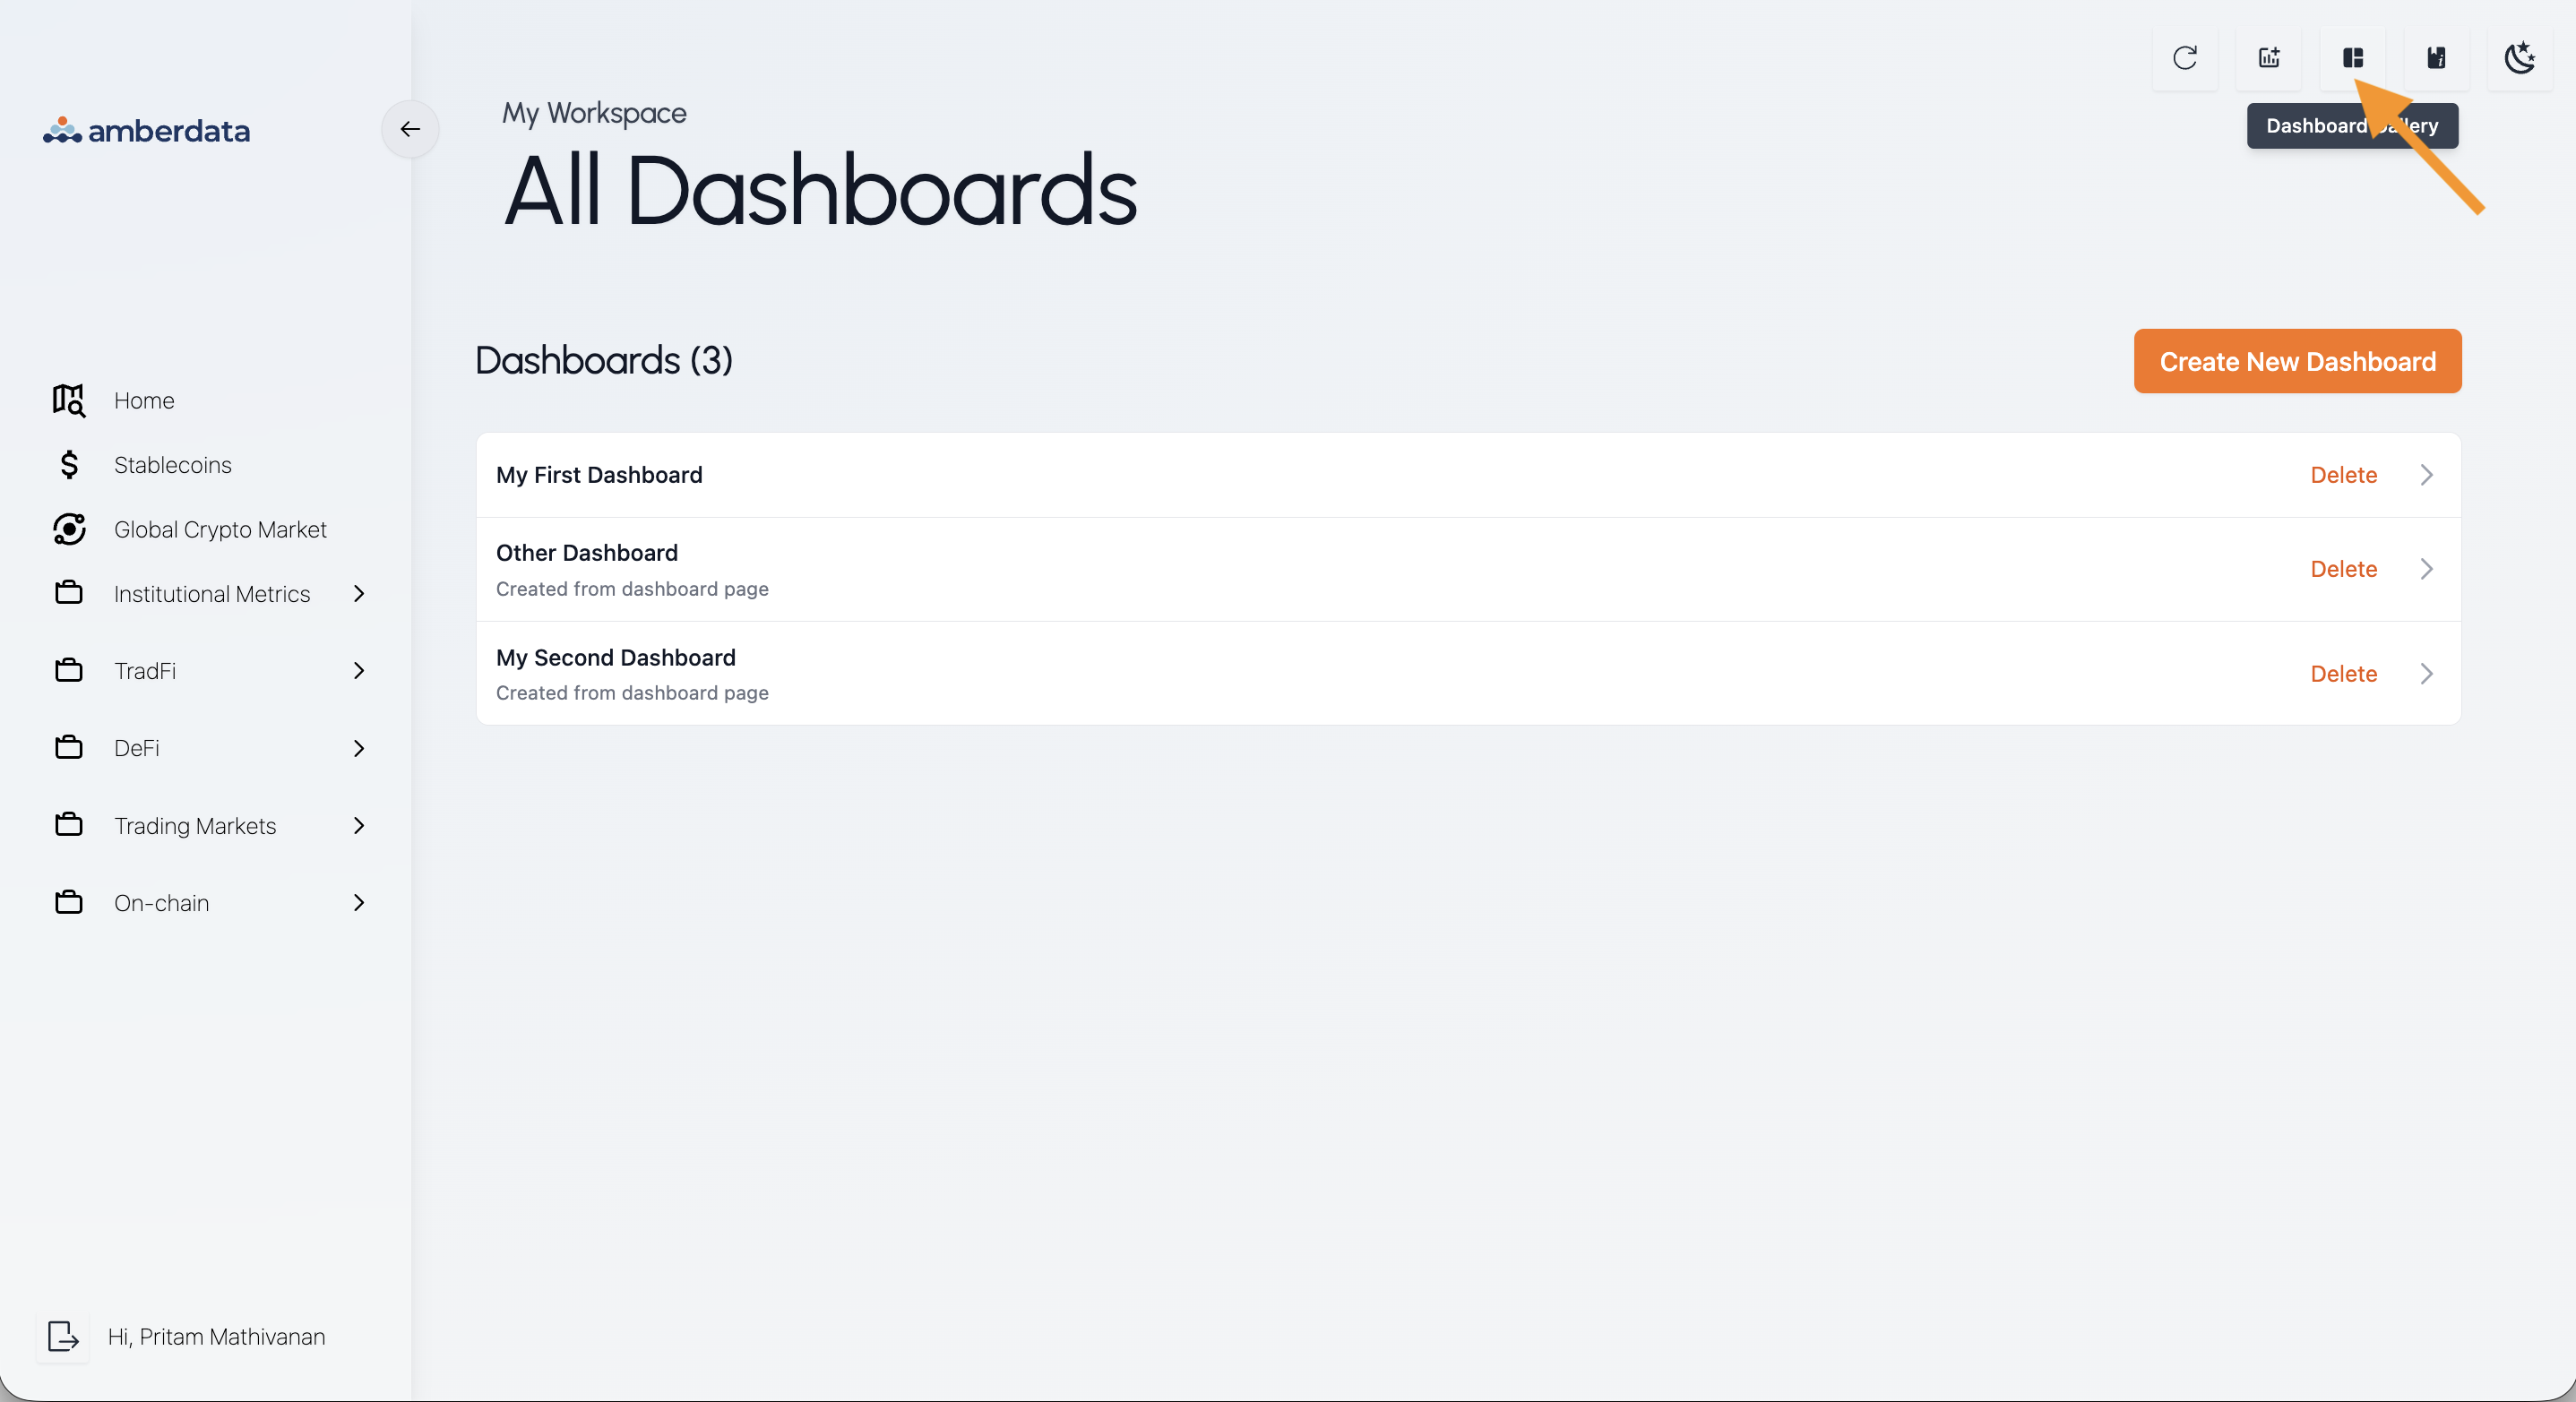 2. From this view, you also have the option to create additional dashboards or delete existing ones
3. Click on any of the dashboards in the list to navigate to that dashboard
2. From this view, you also have the option to create additional dashboards or delete existing ones
3. Click on any of the dashboards in the list to navigate to that dashboard
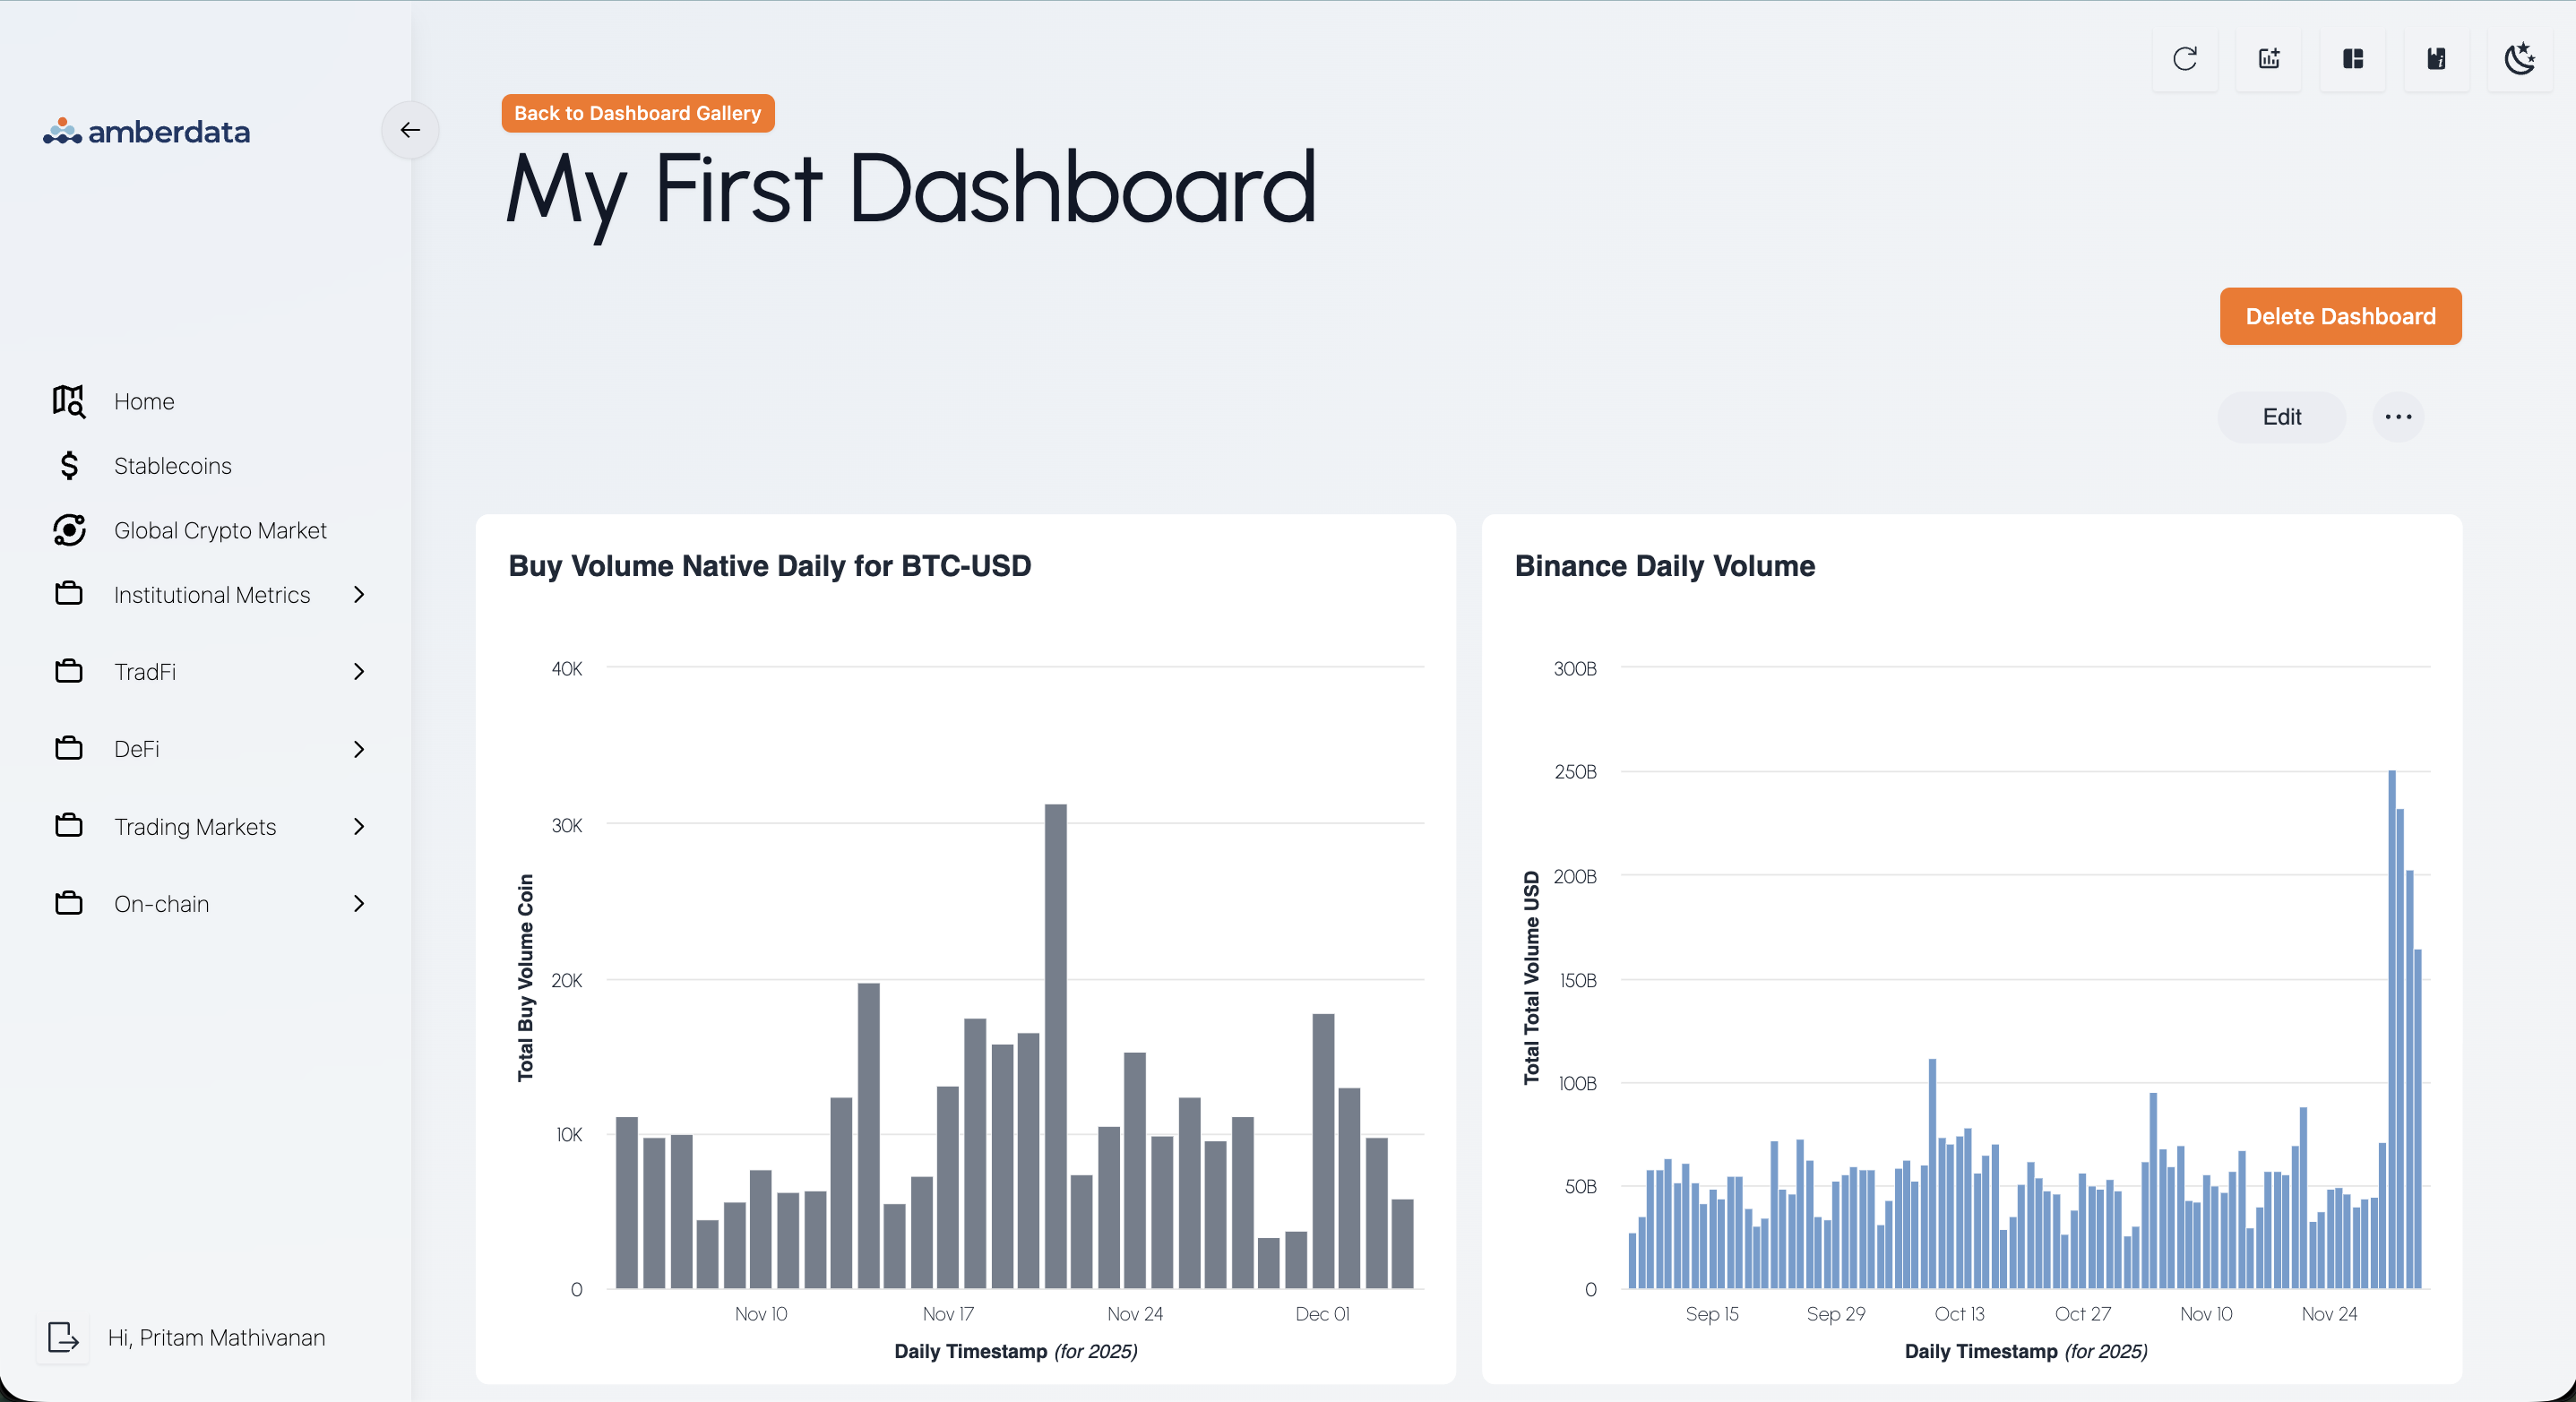
 4. Once you are within your dashboard, you can see the insights (if any) that you've already added
 ### Resizing & Moving Dashboard Visualizations
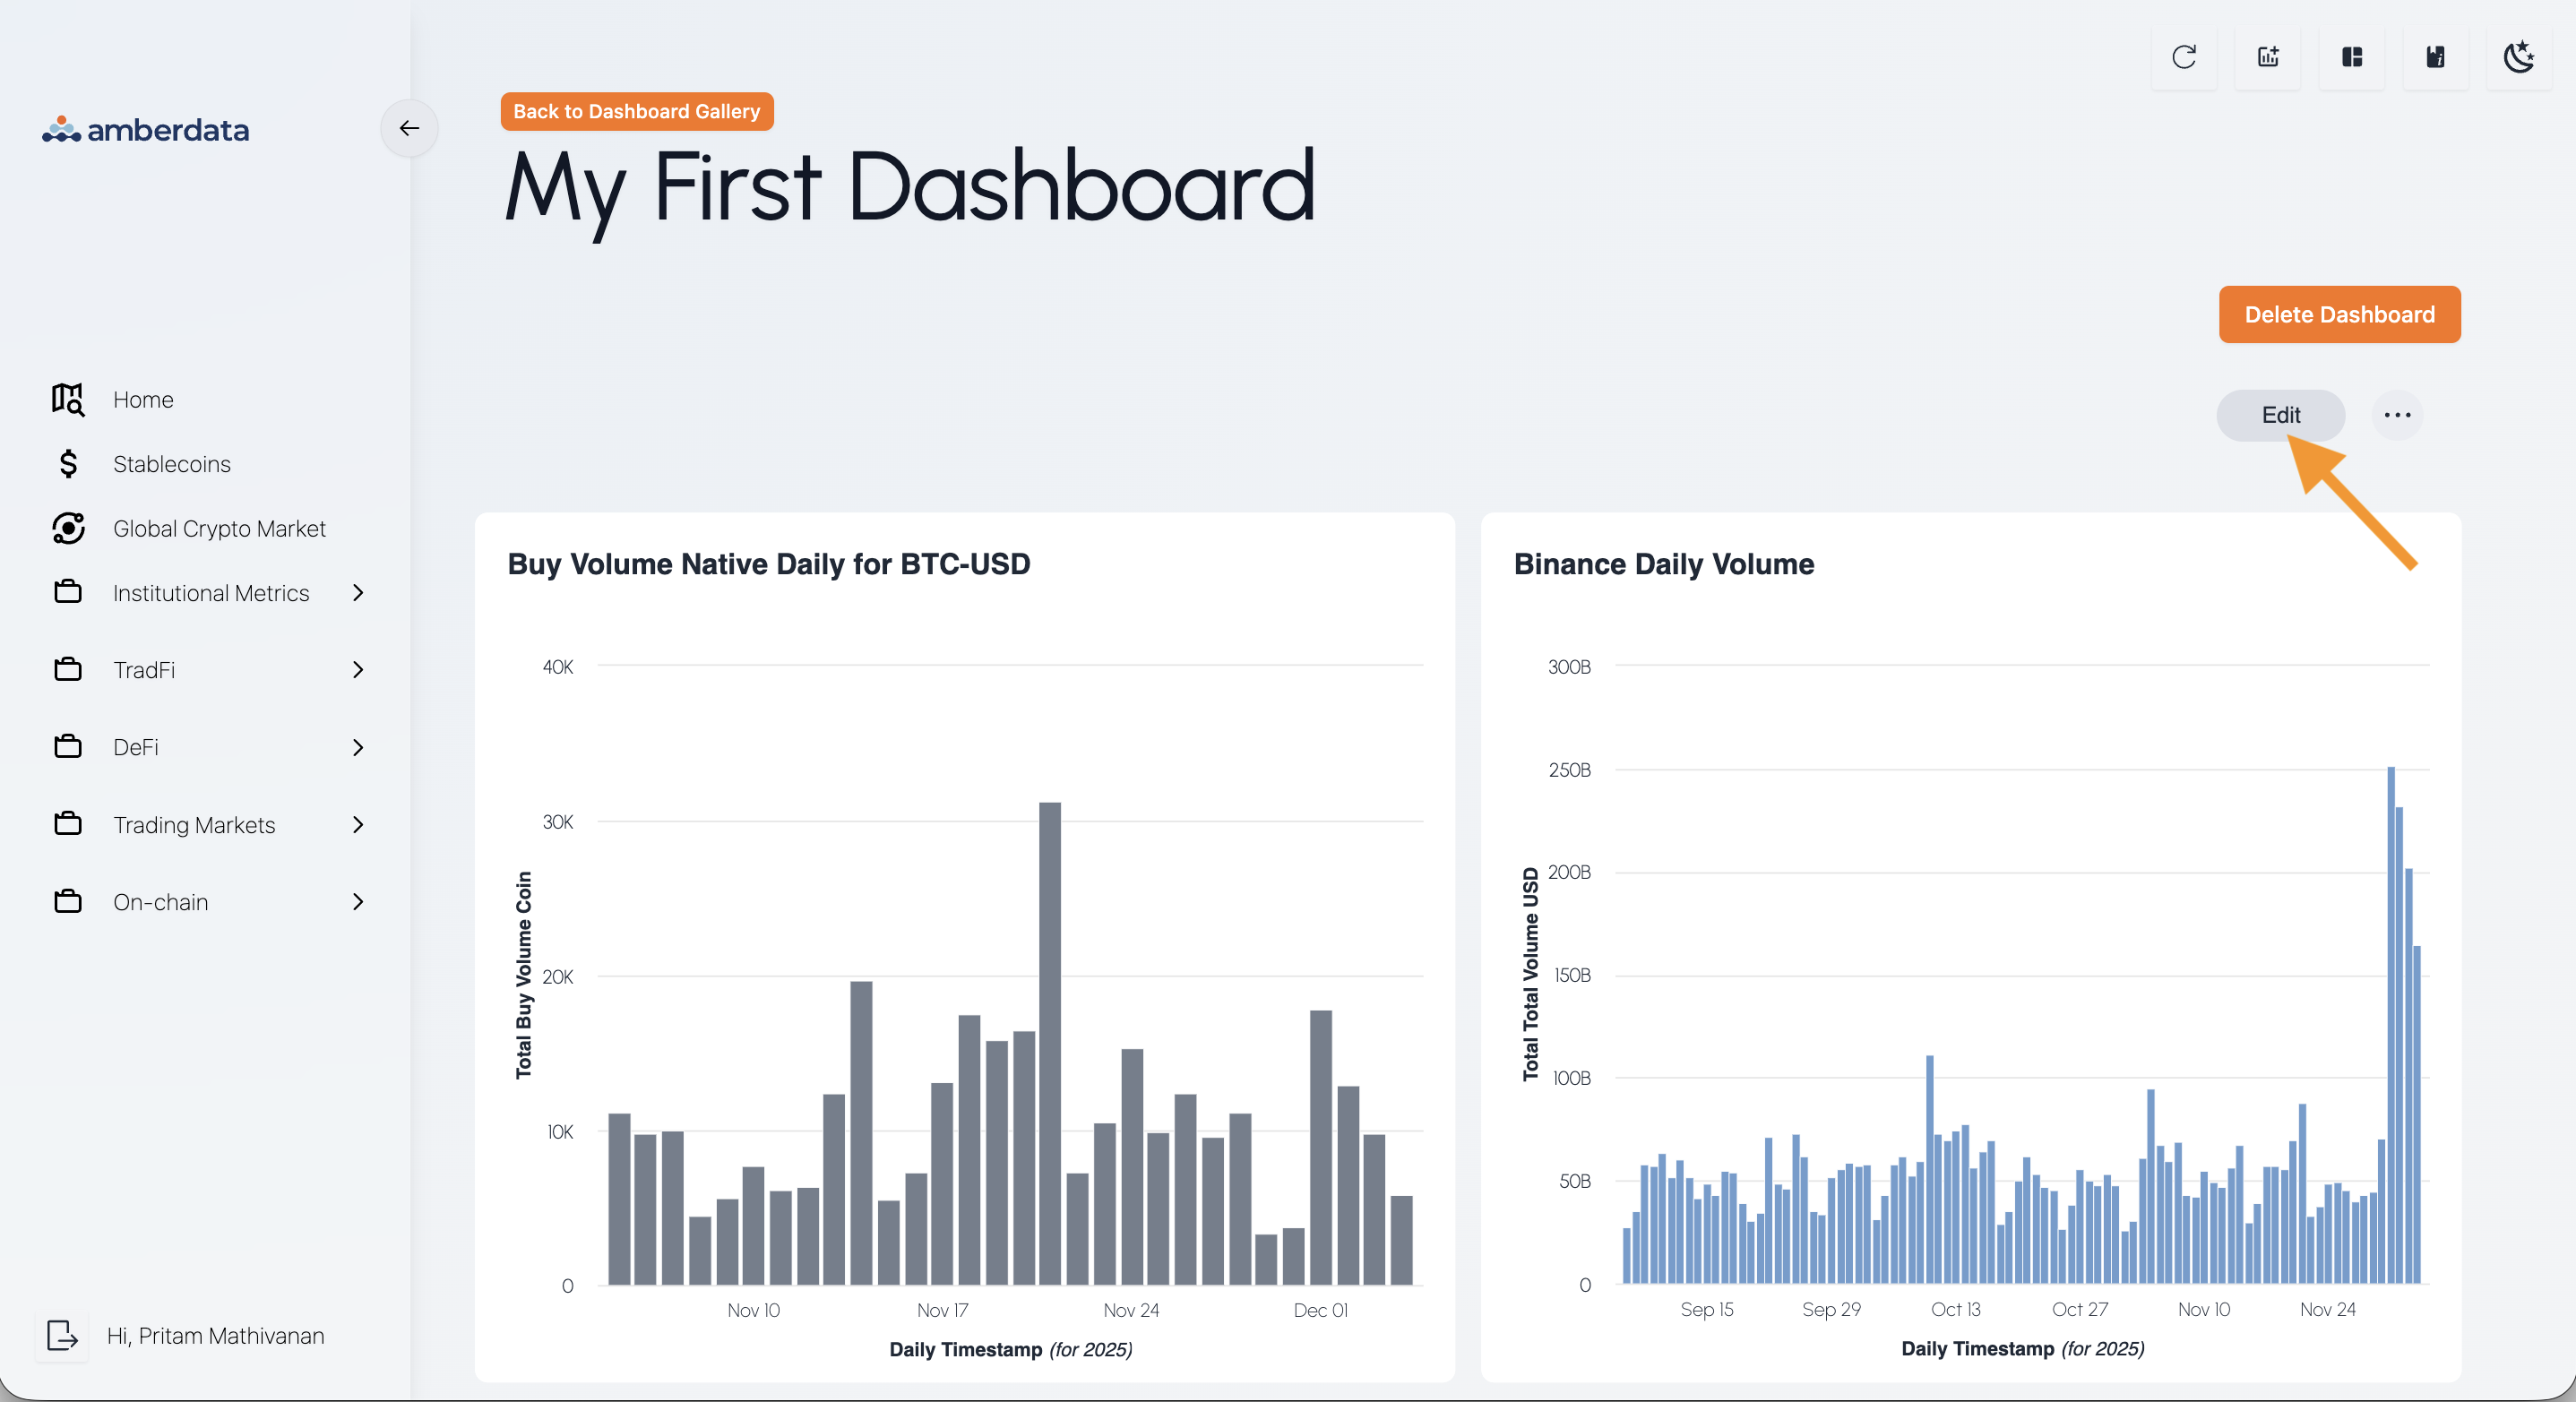
1. Within the dashboard page, click on the *Edit* button in the top right, this will transform your current screen.
### Resizing & Moving Dashboard Visualizations
1. Within the dashboard page, click on the *Edit* button in the top right, this will transform your current screen.
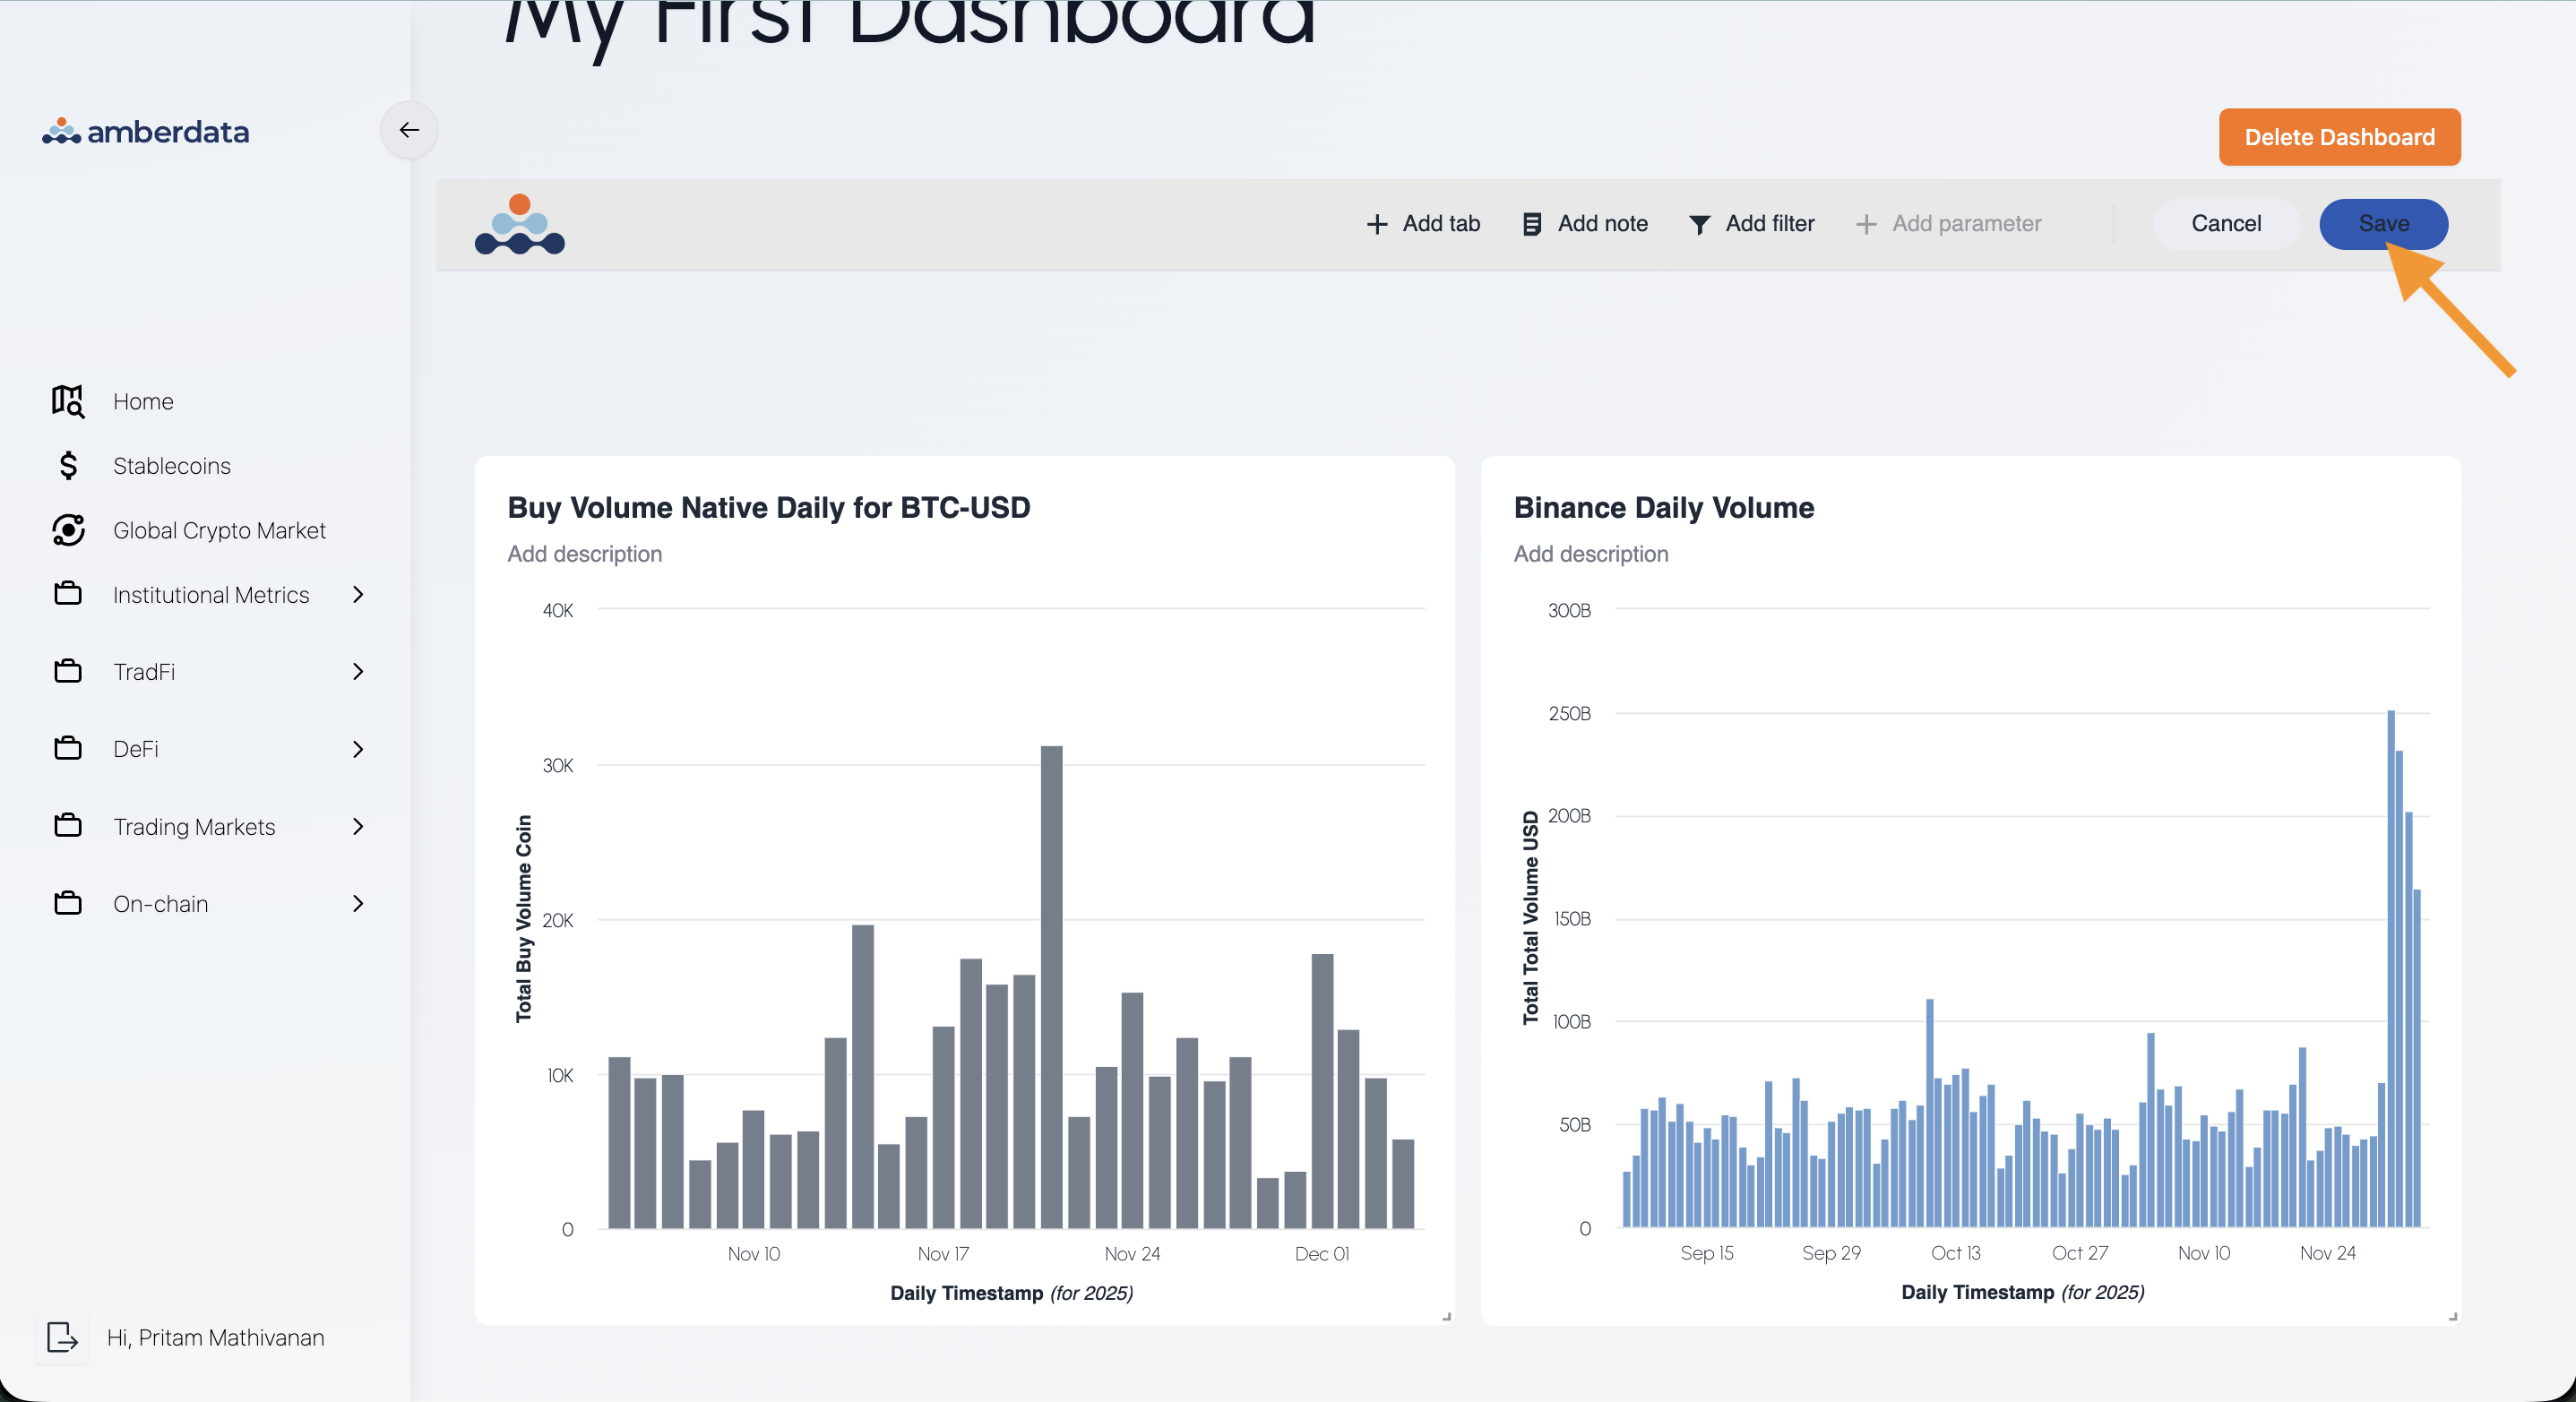
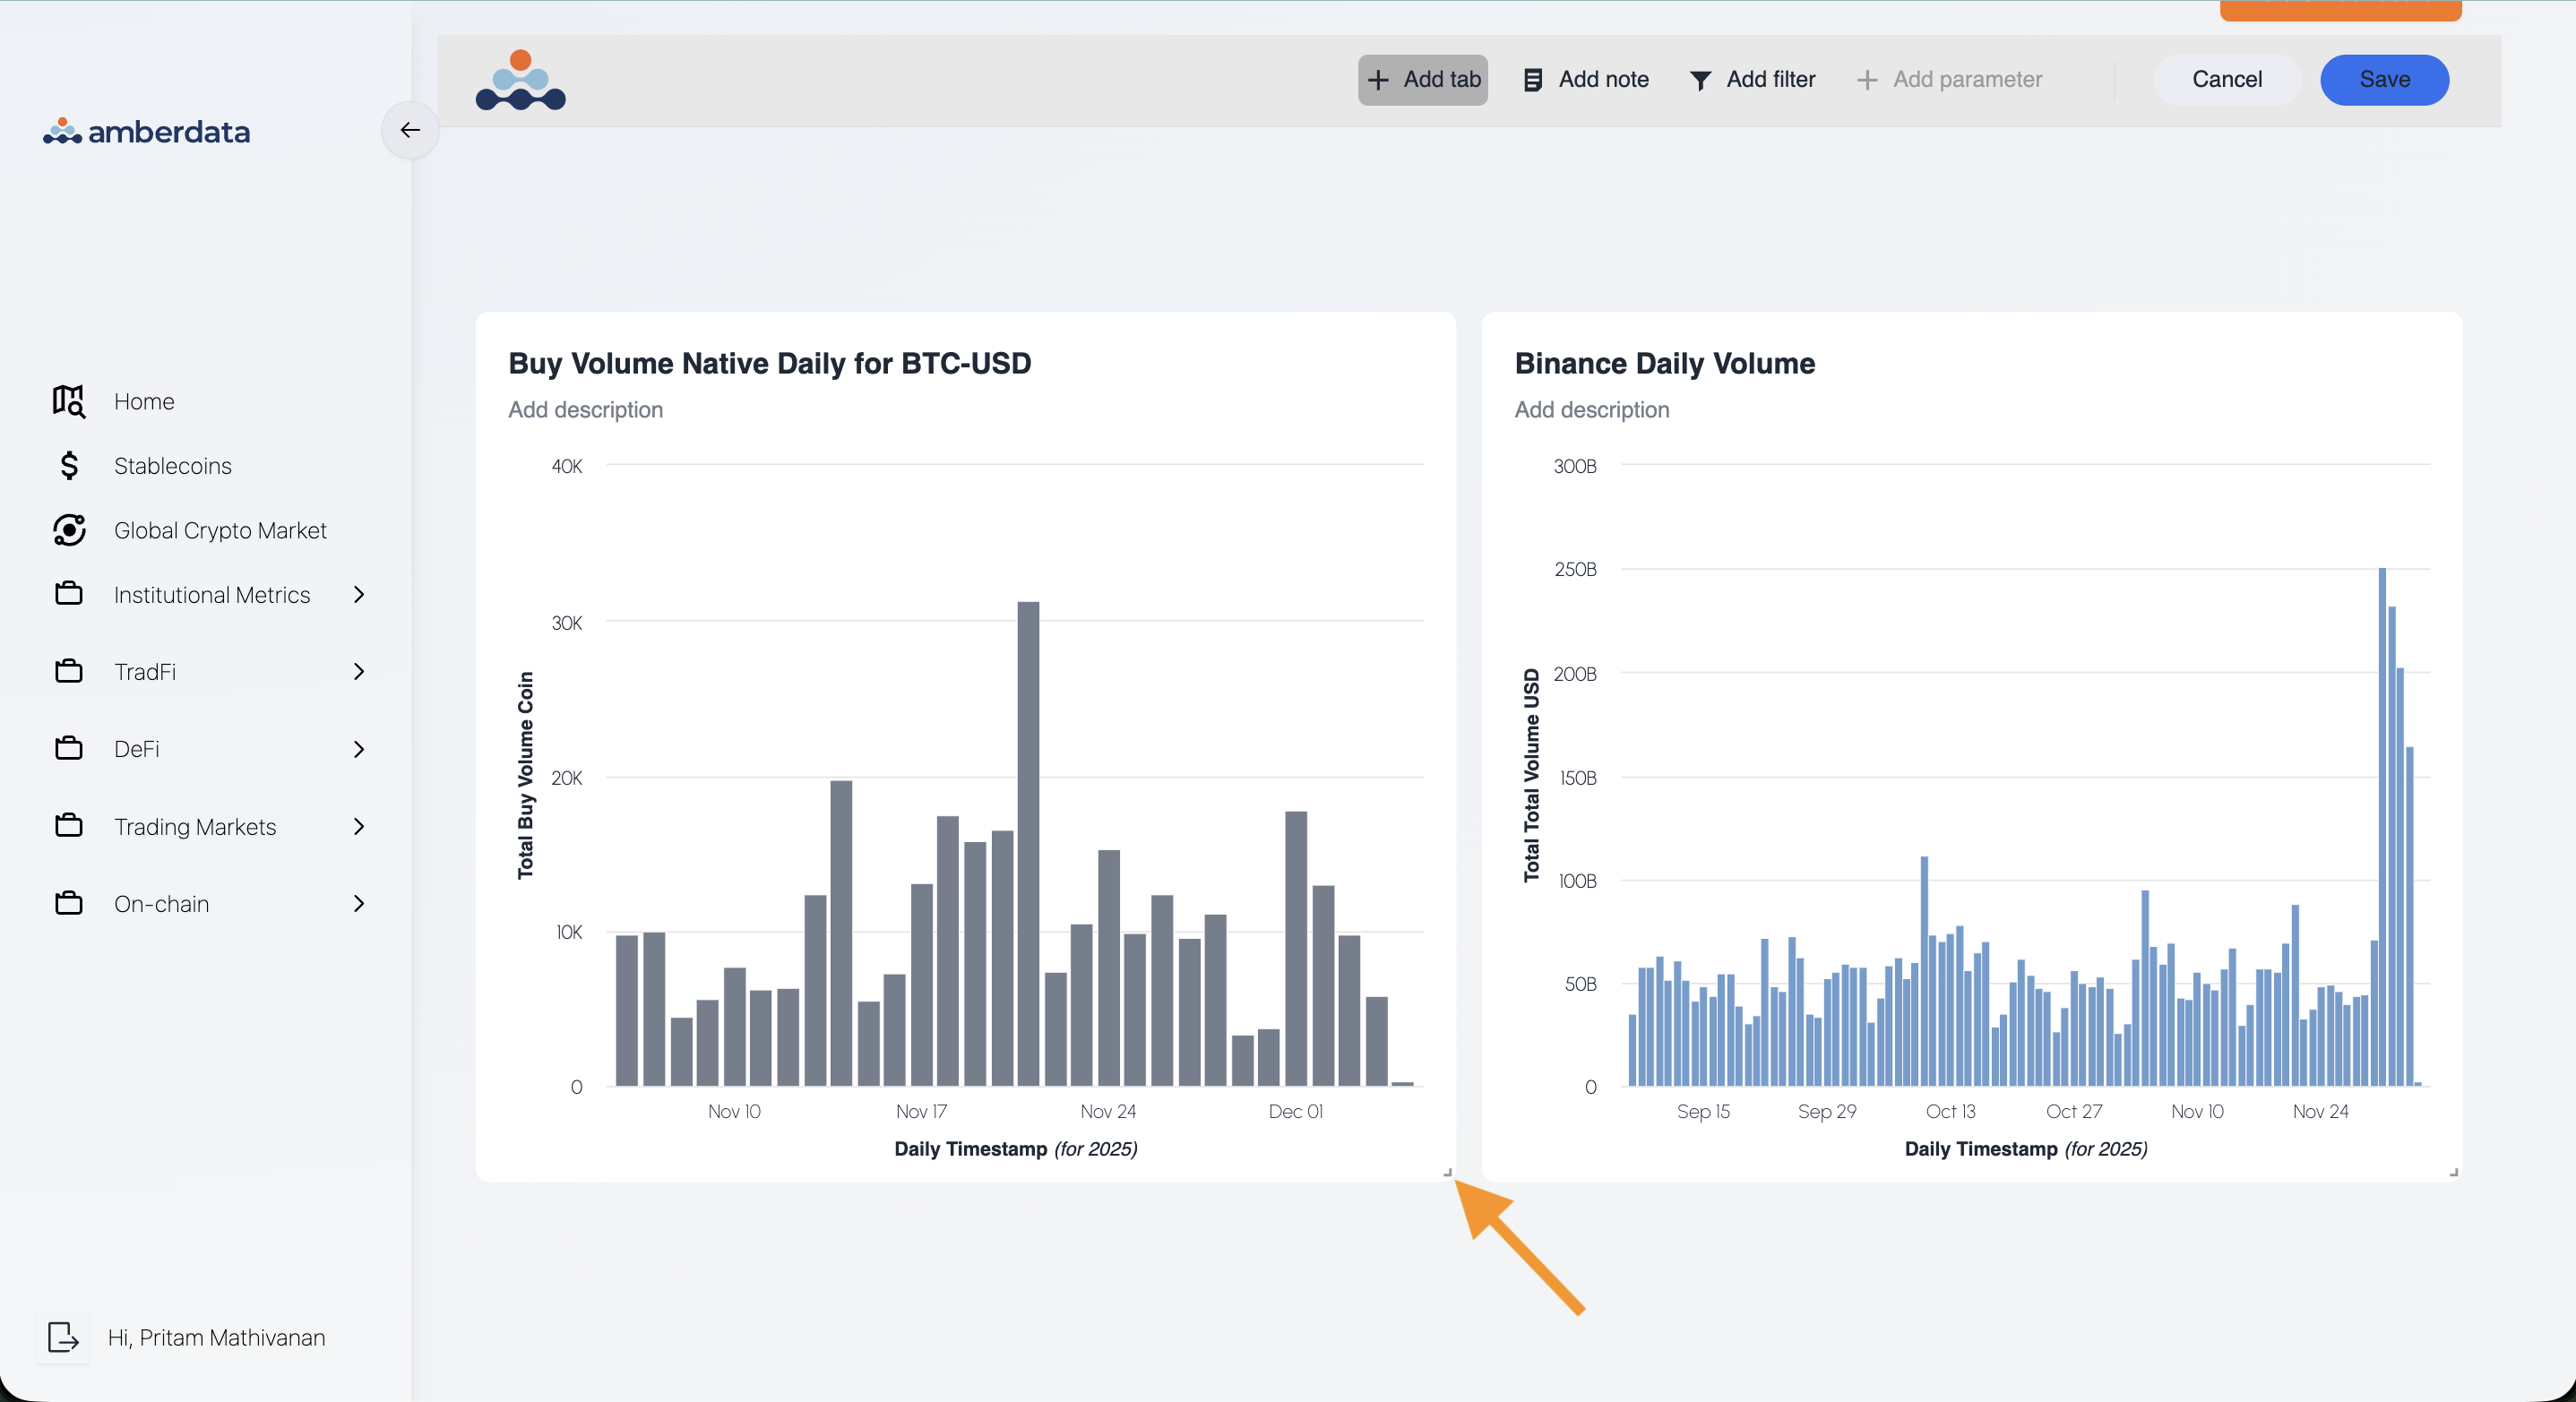
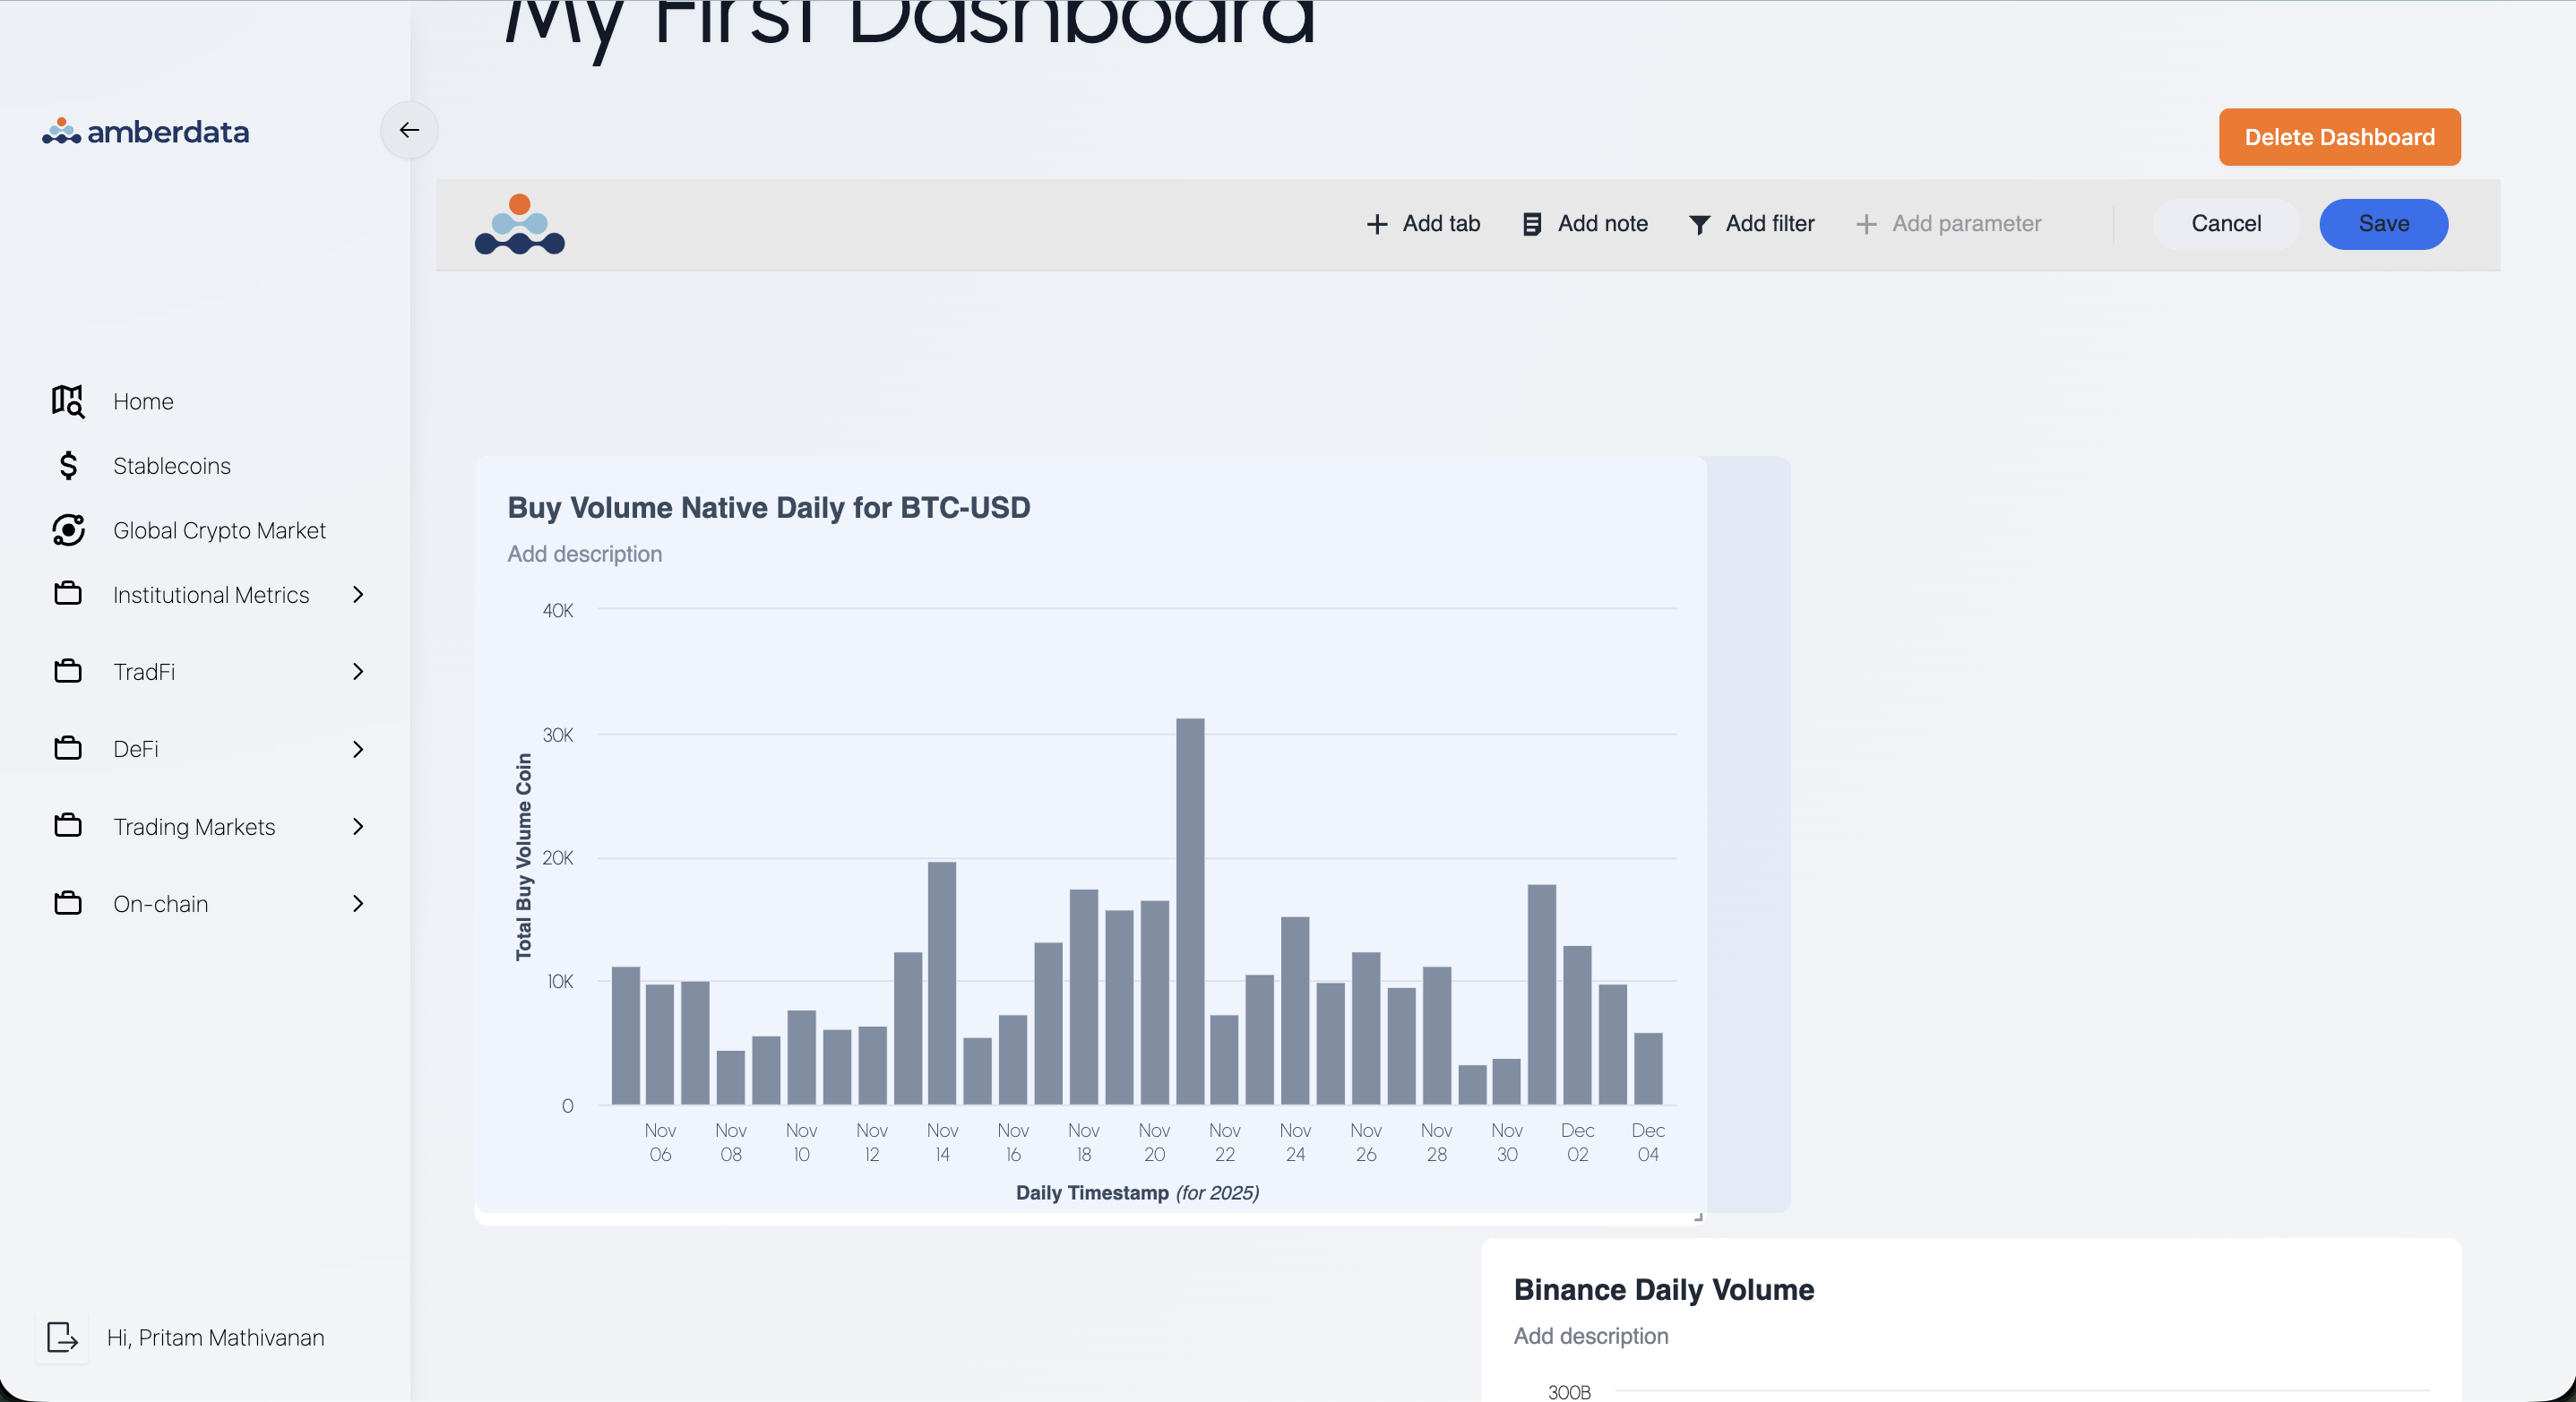
 2. For each visualization you should now see a corner icon in the bottom right, hovering over it will reveal a compass pointer. Click and drag your mouse to resize your chart to your desired size.
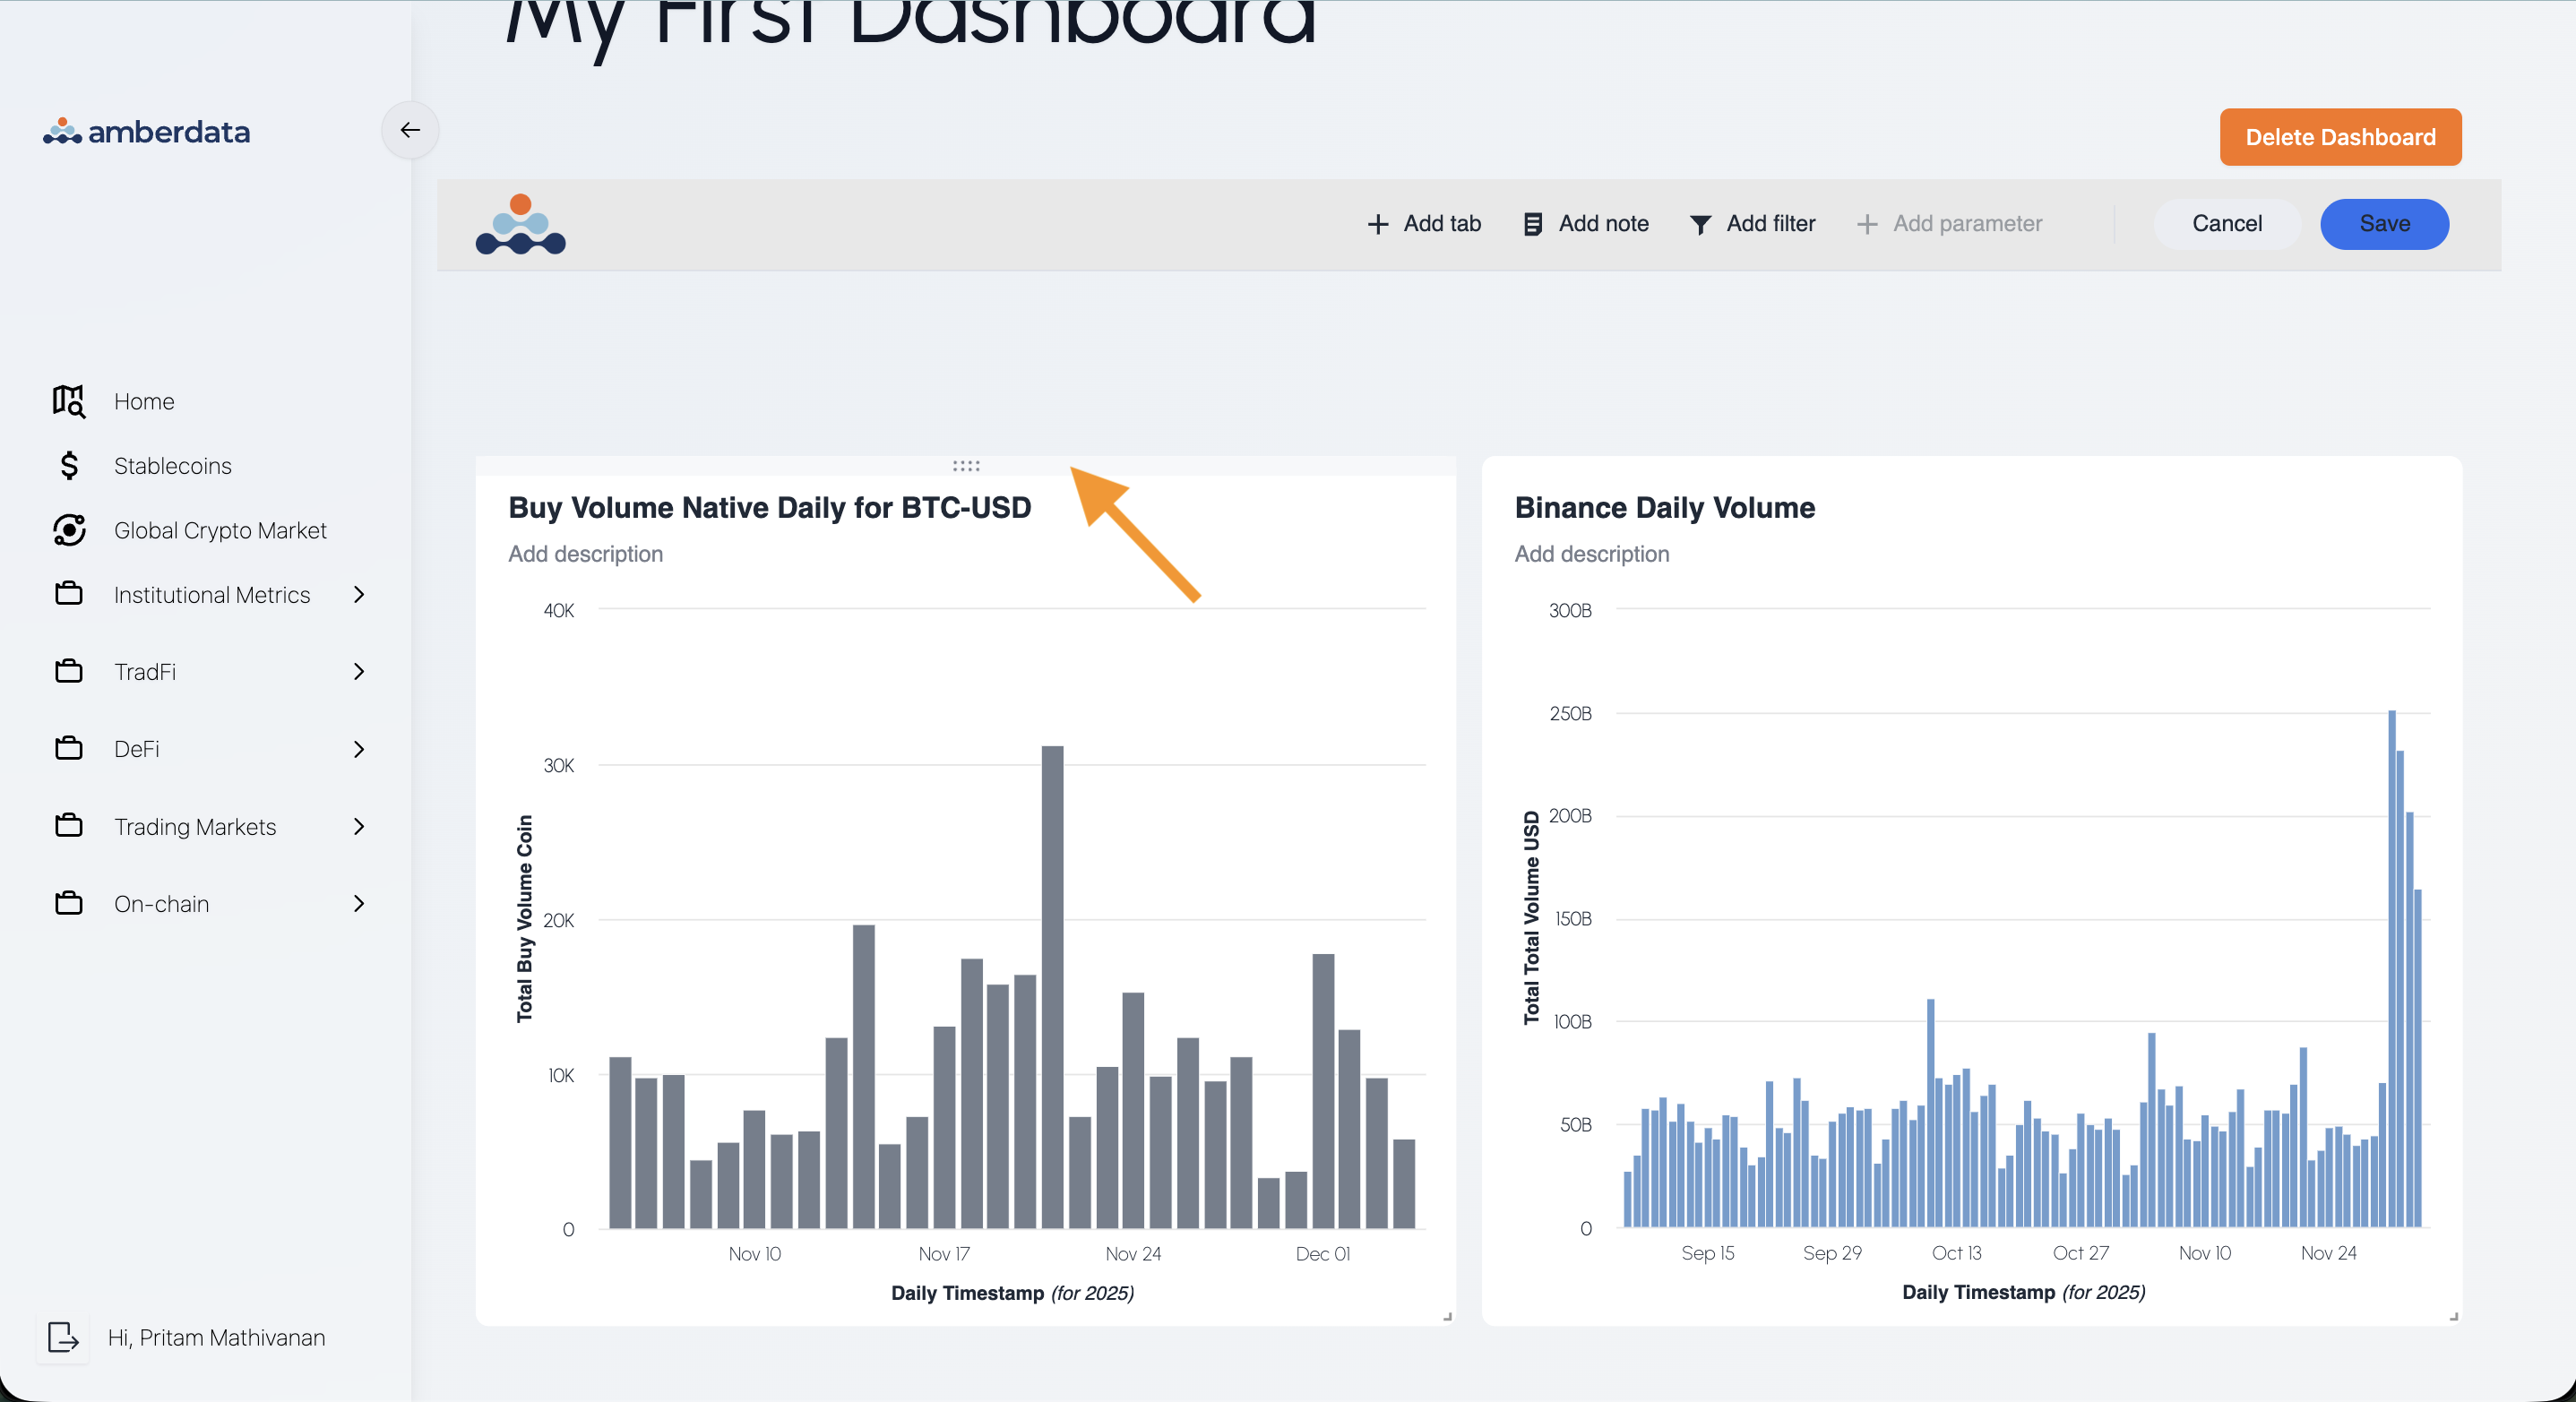
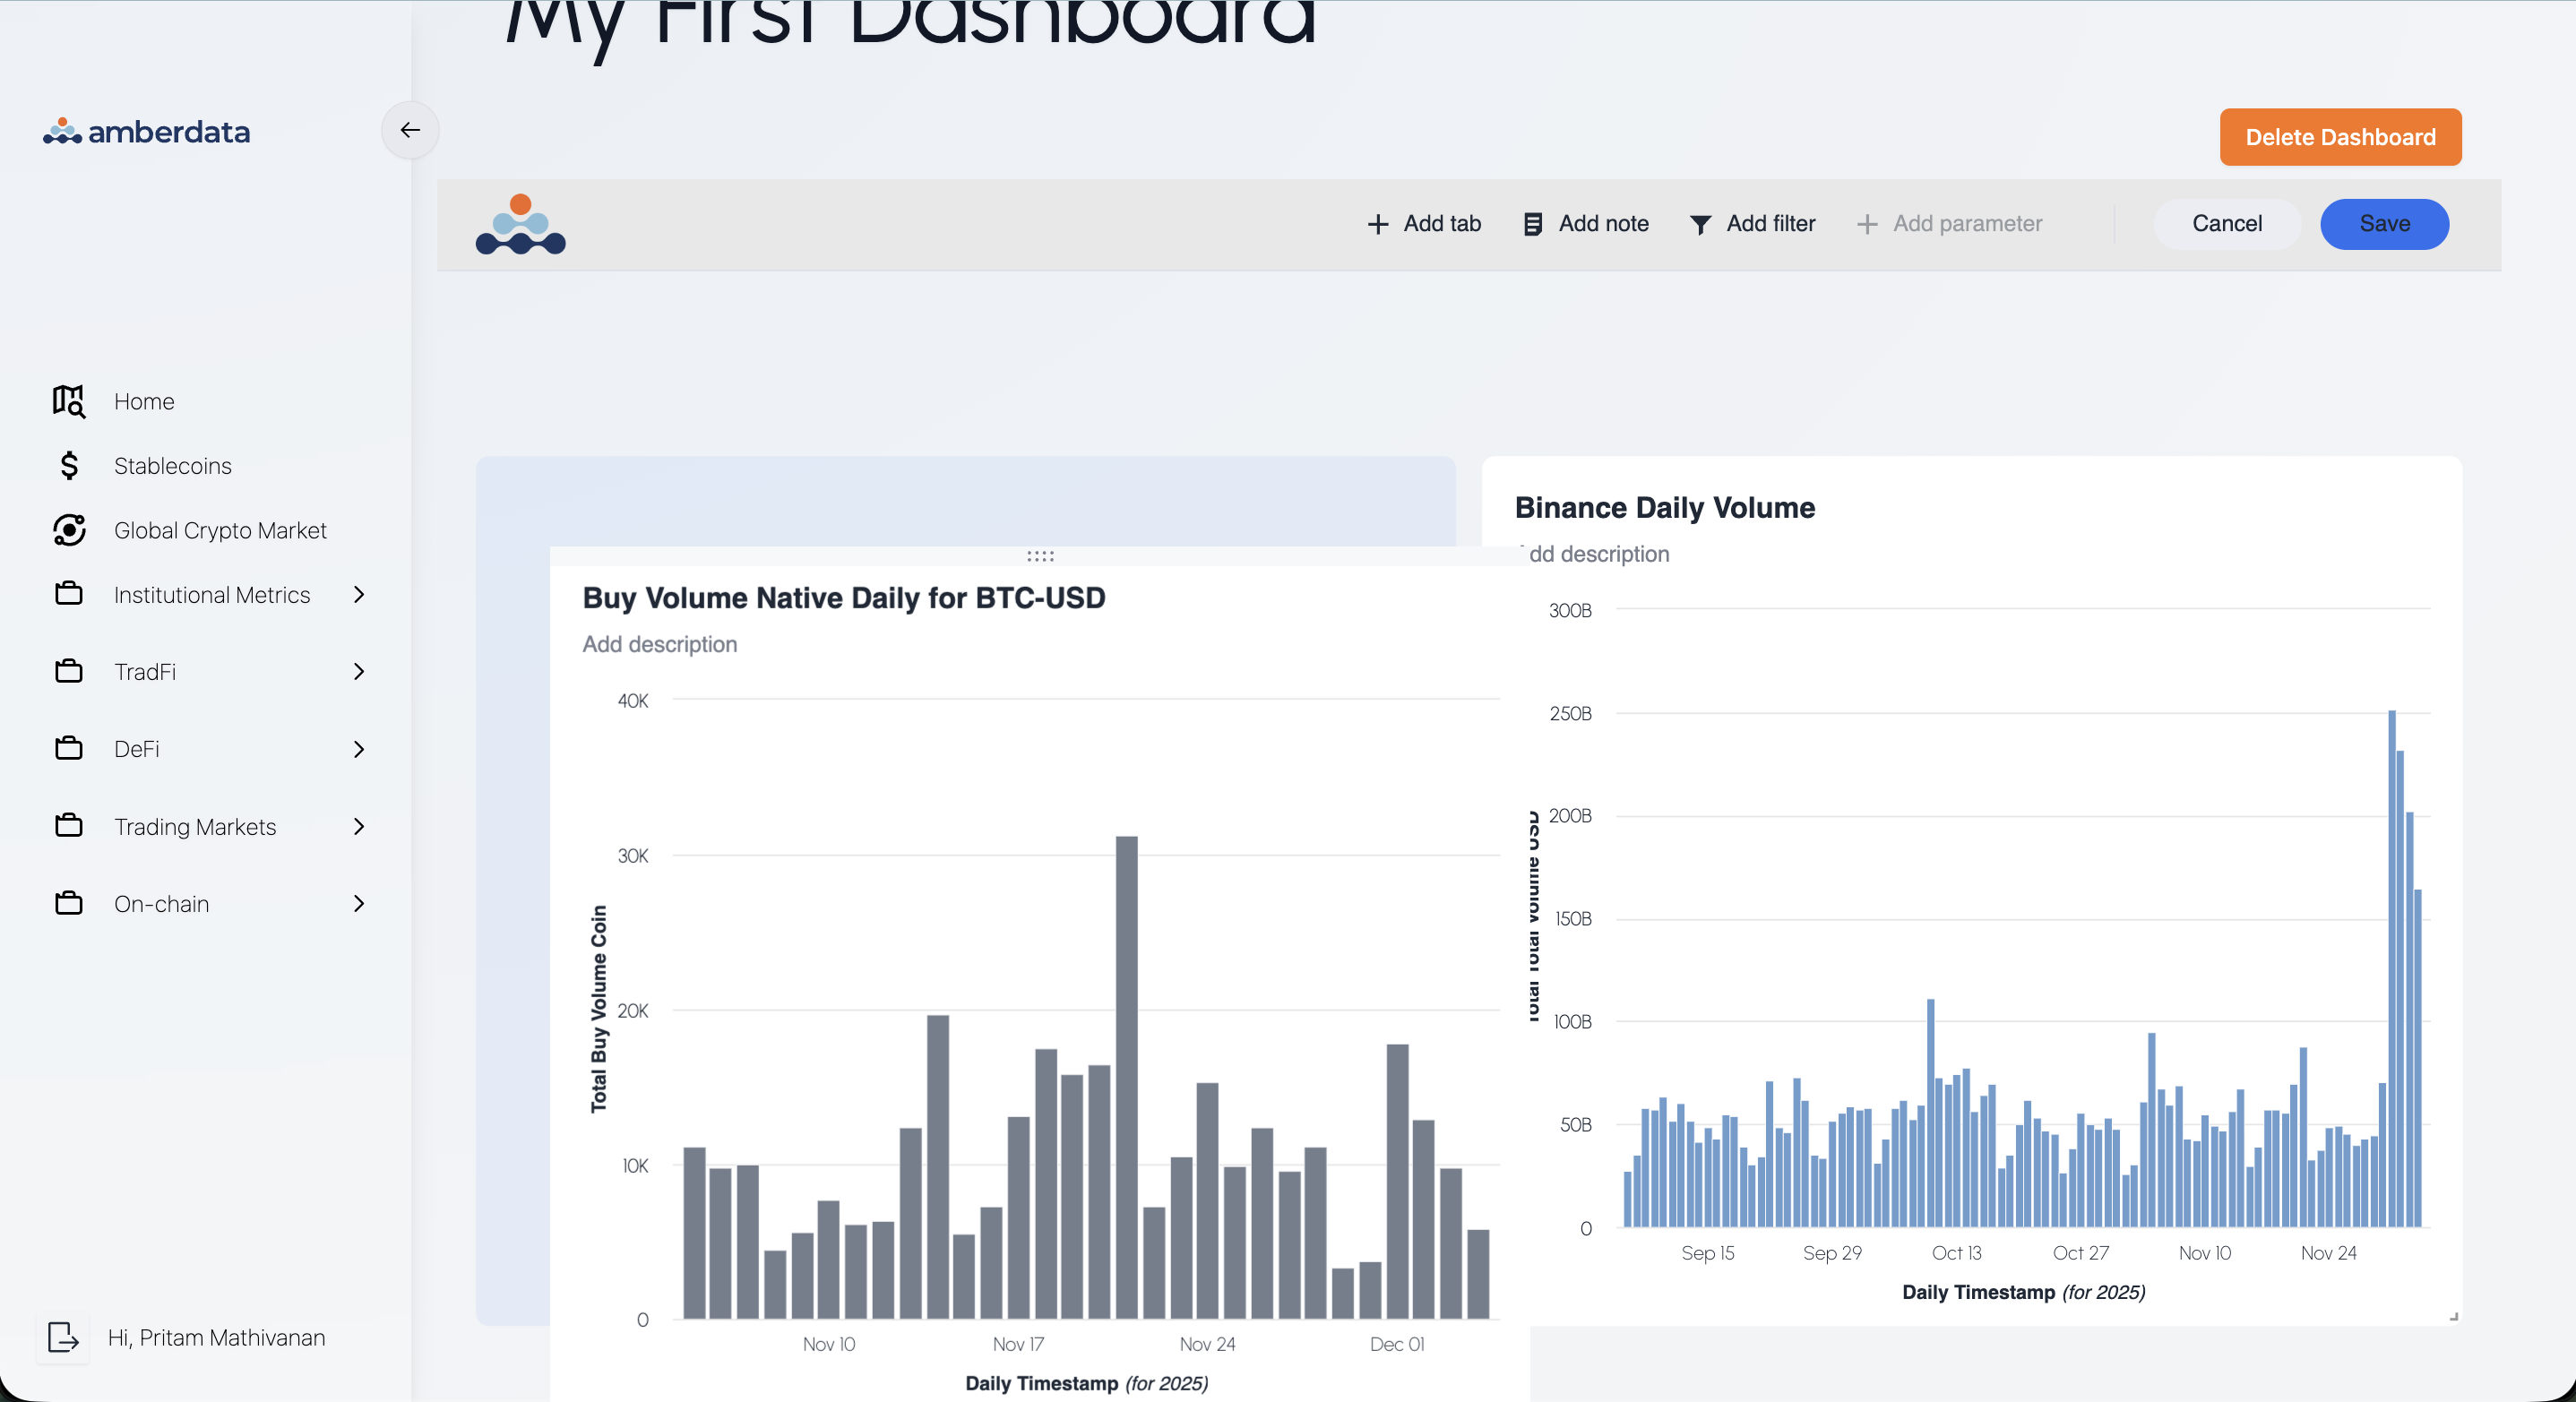
 3. Also for each visualization, if you hover at the top, you'll see a drag icon. Click and drag your mouse to move the entire visualization to another part of the dashboard if you desire.
 4. Once you are satisfied with your edits, click on *Save* in the top right