Stablecoin
Overview
Note: This dataset is updated daily and is available via Databricks, and Snowflake.
Description
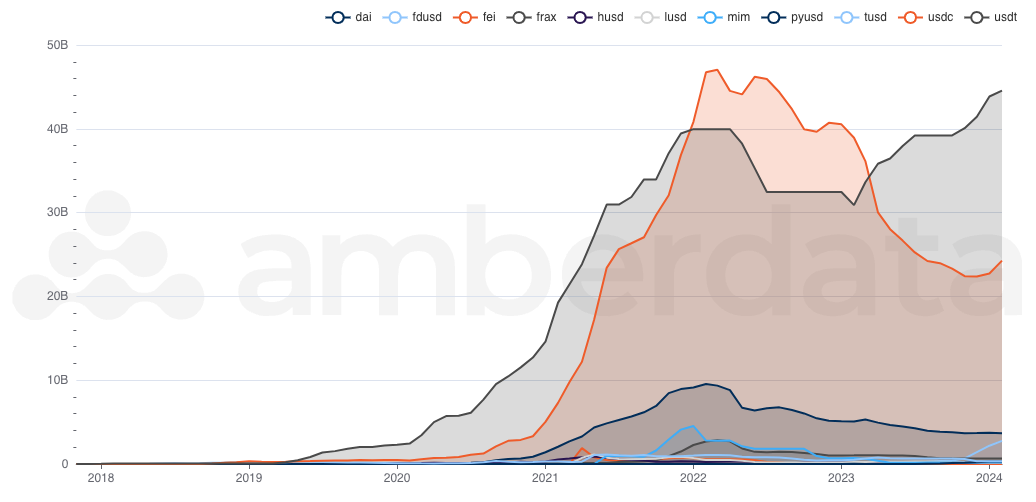
An increase in fiat-backed stablecoins typically signals a positive market trend, reflecting an influx of new capital entering the blockchain ecosystem. Conversely, a decline in stablecoin supply may indicate bearish investor sentiment. Meanwhile, growth in crypto-backed stablecoins highlights an expansion of leverage and more sophisticated financial strategies within the blockchain space. Amberdata’s stablecoin dashboards track the creation (minting) and destruction (burning) of stablecoins on the Ethereum network, along with user activity, prices, market capitalization, and token velocity. Our coverage includes major USD stablecoins such as USDC, USDT, DAI, FUSD, TUSD, FRAX, PYUSD, HUSD, MIM, LUSD, BUSD, USDP, and FEI, as well as EUR stablecoins including EURC, EURT, VEUR, EURS, AEUR, EURA, and SEUR.Use Case
Traders:Traders monitor stablecoin issuance on-chain to identify shifts in market liquidity and sentiment. A rising stablecoin supply may signal increased buying power and potentially bullish conditions, while declines could indicate bearish sentiment or tightening liquidity, informing short-term trading strategies to exploit price movements. Researchers:
Researchers analyze stablecoin issuance to gain insights into blockchain ecosystem health and adoption trends. By examining issuance patterns, they assess trust levels in fiat-backed versus crypto-backed stablecoins and explore how various economic factors influence the digital asset landscape. Analysts:
Analysts focus on stablecoin issuance as a key indicator of investment trends and risk exposure in cryptocurrency markets. A growing stablecoin supply may point to increased market interest or hedging behavior, while a shrinking supply can reflect investor risk aversion. This data supports informed forecasting and portfolio advisory decisions.
Methodology
- Issuance: Measured as the daily mints and burns executed by the token contract.
- Circulating Supply: Calculated as the cumulative sum of issuance over time.
- Market Capitalization (USD and EUR): Derived by multiplying circulating supply by token price. For USD prices, we prioritize daily close prices from centralized spot exchanges. If unavailable, prices are calculated via WETH-based decentralized exchange prices and converted to USD. EUR prices are computed by converting the USD price using the EUR/USD exchange rate.
- Transfers: Counts, sums, and averages all token transfers within the contract, including mints and burns.
- Senders & Receivers: Distinct daily counts of unique input and output addresses involved in token transfers.
- Holders: The number of addresses holding a token balance greater than zero. (Currently available for EUR stablecoins; USD stablecoin holder counts will be added soon.)