Skip to main content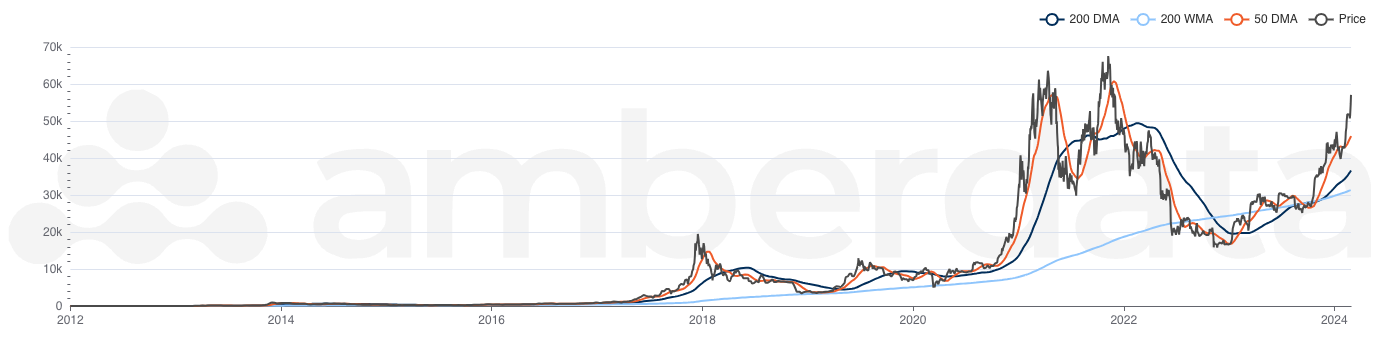
Description
Price is often the primary reference point for analyzing asset performance. By applying technical indicators such as daily and weekly moving averages, it is possible to identify key market dynamics, including support and resistance levels, trend direction, and potential reversal patterns.
Amberdata provides price data and moving average indicators for major assets, including Bitcoin (BTC) and Ethereum (ETH). This includes commonly used indicators such as the 50-day moving average (50DMA) and the 200-day moving average (200DMA).
These indicators are frequently used to identify market signals:
- A death cross occurs when the 50DMA falls below the 200DMA, typically interpreted as a bearish signal that may precede a rebound.
- In uptrending markets, moving averages often serve as support levels.
- In downtrending markets, moving averages may act as resistance, indicating potential ceilings in price action.
Use Case
These moving averages are often short- and mid-term price indicators, commonly used in traditional financial applications.
Methodology
Price and moving averages are calculated by taking the average price over the last n days.