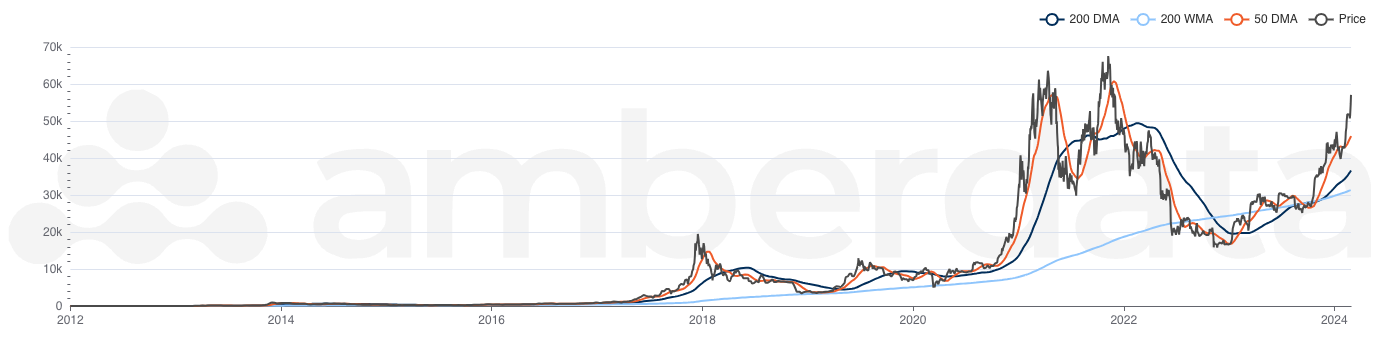
Price is often the primary starting point for analyzing assets. By utilizing daily and weekly moving averages, the price trends of assets such as BTC and ETH can be effectively tracked alongside key technical indicators like support, resistance, and trendlines. Commonly used moving averages include the 50-day moving average (50DMA) and the 200-day moving average (200DMA). These metrics help identify patterns such as the “death cross,” which signals price weakness and has historically preceded price rebounds. During an uptrend, moving averages often act as support levels, indicating the potential bottom of a market cycle. Conversely, in a downtrend, they can function as resistance levels, suggesting the top of a market cycle.Amberdata provides coverage of BTC and ETH prices along with their respective moving averages.
Moving averages serve as short- and mid-term price indicators widely employed in traditional financial markets for trend analysis and trading strategy development.