Price and Moving Averages
Description
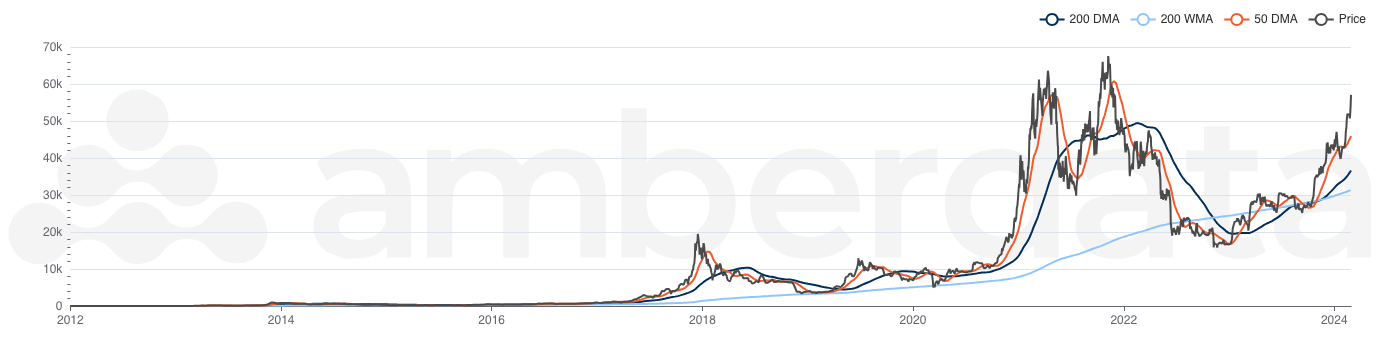
The starting point for assets is most often price. Using daily and weekly moving averages, we can track the price of BTC or ETH along with support, resistance, and trendlines. Using the 50-day moving average (50DMA) and the 200-day moving average (200DMA), you can see patterns such as death crosses, which signal price weakness and historically precede price rebounds. In an uptrend, moving averages can act as "support" lines indicating the bottom of a market cycle, while in a downtrend moving averages can act as a ceiling line, indicating the top of a market cycle
We cover ETH and BTC price and moving averages.
Use Case
These moving averages are often short- and mid-term price indicators, commonly used in traditional financial applications.
Methodology
We calculate this by taking the average price over the last n days.
Updated about 2 months ago