USD & EUR Stablecoins
Note: This dataset is updated daily and is available via Databricks, Google BigQuery, and Snowflake.
Description
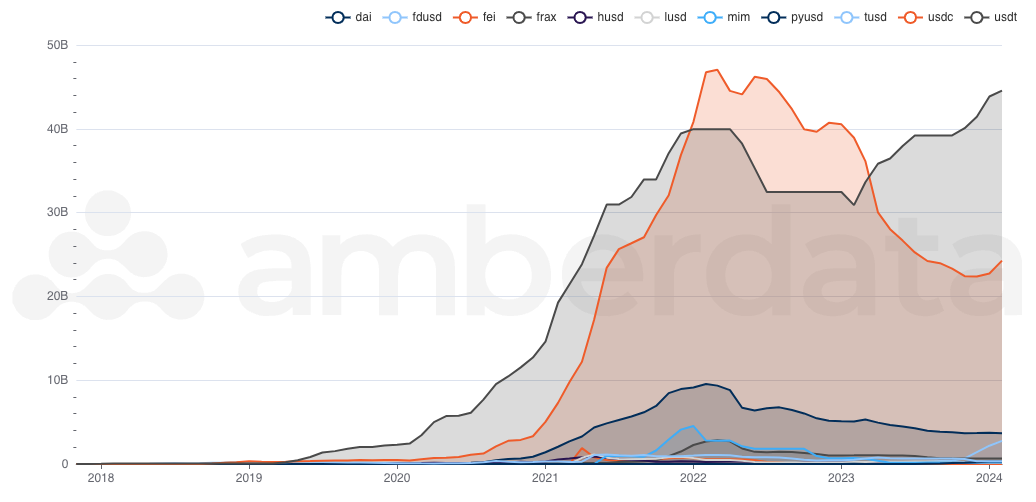
An increase in fiat-backed stablecoins signals a positive trend, suggesting an influx of new capital entering the blockchain. Conversely, a decline in stablecoins could reflect a bearish sentiment among investors. Moreover, a rise in crypto-backed stablecoins indicates an expansion of leverage within the blockchain ecosystem, showcasing dynamic financial strategies being employed. Our stablecoin dashboards show the creation and destruction of Stablecoins on the Ethereum network, as well as user activity, prices, market capitalization, and velocity. We currently cover the following USD stablecoins: USDC, USDT, DAI, FUSD, TUSD, FRAX, PYUSD, HUSD, MIM, LUSD, BUSD, USDP, and FEI. We also cover the following EUR stablecoins: EURC, EURT, VEUR, EURS, AEUR, EURA, SEUR.
Use Case
Trader: Traders focus on stablecoin issuance on-chain to identify market liquidity and sentiment shifts. An influx of stablecoins might signal increased buying power, potentially leading to bullish market conditions. Conversely, a decrease could indicate bearish sentiment or reduced liquidity, influencing their short-term trading strategies to capitalize on price movements.
Researcher: Researchers are interested in stablecoin issuance as it offers insights into the broader blockchain ecosystem's health and adoption rates. By analyzing issuance trends, they can deduce the level of trust in fiat-backed versus crypto-backed stablecoins, understanding how different economic factors affect the blockchain space.
Analyst: Analysts pay attention to stablecoin issuance on-chain to gauge investment trends and risk exposure in the cryptocurrency market. A growing supply of stablecoins can suggest an increasing interest in the crypto market or a hedge against volatility, while a decline may highlight risk aversion among investors. This information is crucial for making informed predictions and advising clients or organizations on portfolio strategies.
Methodology
Issuance - Issuance is the daily mints and burns of a token by the token contract.
Circulating Supply - Circulating supply is the cumulative sum of issuance.
Market Capitalization (USD and EUR) - Market capitalization is the circulating supply multiplied by the token price. In the case of USD, we first rely on daily close centralized spot trading prices, but in the case that the token is not traded on a centralized exchange, we calculate the token price in WETH (using the daily close decentralized exchange price) and then convert WETH to USD. For the token price in EUR, we convert the token’s USD price by the EUR/USD exchange rate.
Transfers - Transfers are the count, sum, and average of all transfers on the token contract (which often includes mints and burns).
Senders & Receivers - Senders and receivers are the distinct counts of input addresses and output addresses, daily.
Velocity - Token velocity is directly calculated from the Amberdata API: https://docs.amberdata.io/reference/get-token-velocity
Holders - Holders are calculated as the number of users with a token balance greater than 0. Note: Currently only available for EUR stablecoins. USD stablecoins will be added in the near future.
Updated about 2 months ago