Liquid vs Illiquid Supply
Description
Daily address balance metrics provide insights into the diversity of the network and changes to network adoption.
- Balance changes represent every change in token balance for every address
- Address balances contain a daily list of addresses and the total balance of tokens they hold
- BTC balance buckets contain an aggregation of the number of addresses and total number of tokens held by addresses with various balances (in 1e10 increments ranging from 0 and 0.000001 BTC to 10,000+ BTC)
- USD balance buckets contain an aggregation of the number of addresses and total number of tokens held by addresses with various balances (in 1e10 increments ranging from 0 to $10,000,000 USD)
- Addresses in profit count the total number of addresses with an average token price (tokens are valued at the day they move to the address) greater than the end of day price, and the total number of tokens held by those addresses.
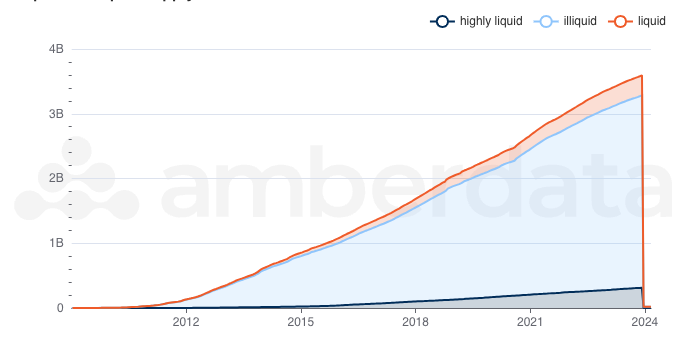
- Liquid vs illiquid supply calculates the number of tokens held by addresses with a liquidity score in various ranges. The liquidity score is calculated as the ratio between outputs and inputs. The ranges are:
- 0 - 0.25: The address is considered illiquid
- 0.25 - 0.75: The address is considered liquid
- 0.75 - 1: The address is considered highly liquid
Addresses in Profit:
This metric shows what percent of the total address space is in a profitable position, or in other words, the percentage of unique addresses whose assets have an average buy price that is lower than its current price.
Liquid vs Illiquid supply:
Understanding an asset's liquidity is crucial to understanding its market. If an asset is highly illiquid, it could indicate a bullish environment and strong HODLing sentiment.
We cover ETH and BTC liquid vs illiquid supply.
Use Case
Trader
Traders can use these metrics to understand the shifts in network behaviors, as growth or decline in address balances, movement of liquid to illiquid balances, and growth or decrease of addresses in profits may help traders make more informed decisions on when to buy and when to sell.
Analyst
Analysts can use these metrics to support profitability and wallet metrics for their own portfolios.
Researcher
Researchers can use these metrics to determine market trends and discover patterns in network behaviours.
Methodology
The liquidity score for every address is calculated as the cumulative absolute sum of outputs divided by the cumulative sum of inputs. This ratio is considered the “liquidity score”. Every address will have a liquidity score every time its balance changes.
- WHEN b.liquidity_score <= 0.25 THEN 'illiquid'
- WHEN b.liquidity_score <= 0.75 THEN 'liquid'
- ELSE 'highly liquid'
Updated about 2 months ago