DeFi Lending
Note: These datasets are available via REST API, Databricks, Google BigQuery, and Snowflake.
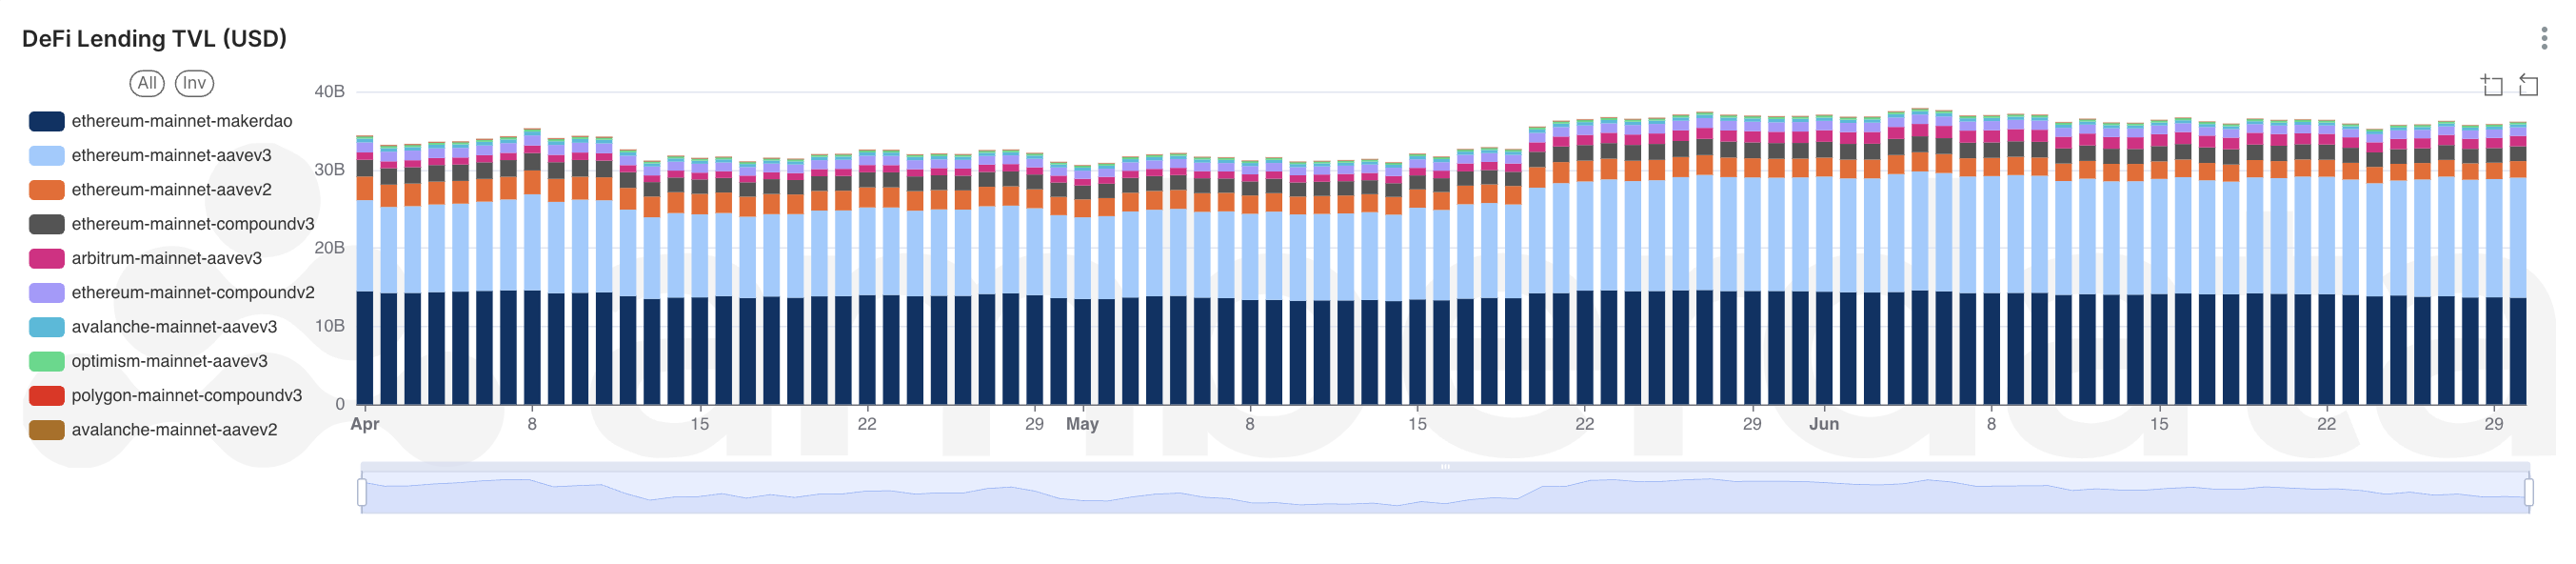
Description
The DeFi Lending metrics are split between stablecoins, protocols, and networks giving researchers, analysts, and traders a comprehensive overview of the ongoing and historical market trends. This dashboard on AmberLens is restricted to three months of historical data and includes visualizations spanning across Avalanche, Arbitrum, Ethereum, Optimism, and Polygon in addition to all lending activity across Aave v2, Aave v3, Compound v2, Compound v3, and MakerDAO.
Use Case
Trader: Traders can use this data to gain a perspective on potential collateral risks and high flow of funds into or out of DeFi Lending protocols and monitor the activity of specific protocols on multiple networks.
Researcher: Researchers can use these visualizations to gain a thorough understanding of the impacts of DeFi Lending on token prices and evaluate how market cycles impact borrowing activity or liquidations.
Analyst: Analysts can use these datasets for a variety of purposes including monitoring deposit and withdrawal volumes for an indication of additional liquidity risks or support or evaluating borrow and repayment volumes for indications of wider liquidity or large flow of funds across protocols and networks.
Methodology
These dashboards utilize Amberdata’s DeFi Data endpoints: Metrics and Stablecoin metrics
Updated about 2 months ago