RV + RV Misc.
Definition
The endpoints mentioned here offer diverse perspectives on Realized Volatility (RV), examining how much a particular cryptocurrency's price has changed over a certain period and evaluating the distribution of these changes across different segments of time. This set of endpoints can offer insights on volatility over 5 days, 10 days, specific days of the week, and months, and how volatility correlates or relates to other factors such as Beta, Parkinson volatility, and others. These metrics provide traders and investors with valuable data to understand past price fluctuations and inform future strategies.
Details
The RV 5Days and RV 10Days endpoints provide a snapshot of realized volatility over the past 5 and 10 days respectively. RV DayOfWeek, RV DayOfWeek HourOfDay, and RV DayOfWeek Month allow a more granular view of volatility across various segments of time. The RV Month endpoint offers a view of the realized volatility for each calendar month.
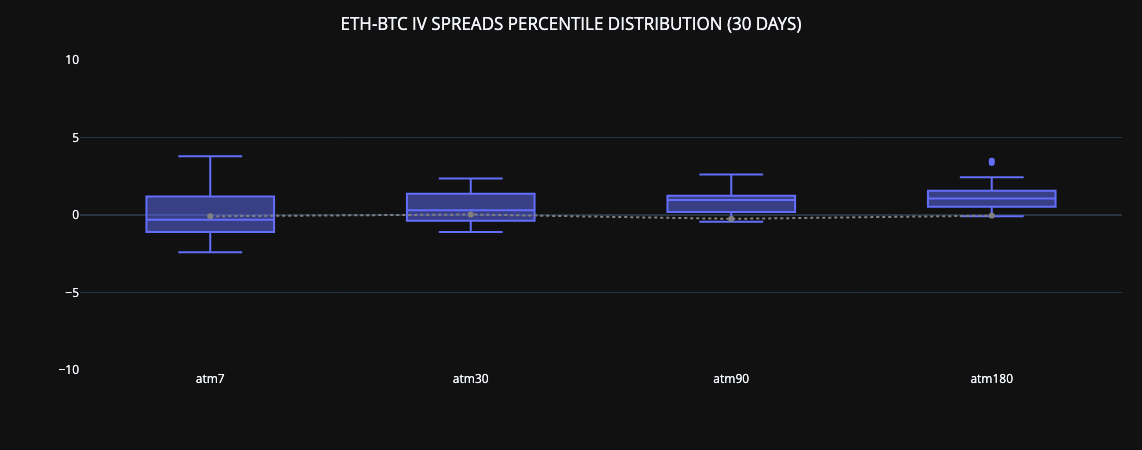
The RV Percentiles Distribution UpDown endpoint provides insights into the distribution of price changes, giving traders a deeper understanding of potential outcomes. The RV Spot UpDown is focused on the directionality of the price changes, whereas RV CloseToClose Parkinson uses Parkinson's measure of volatility, which accounts for intraday price movements.
The RV Beta endpoint provides a measure of the systemic risk associated with a particular cryptocurrency by comparing its changes to a market benchmark. The RV Correlation endpoint examines the relationship between the price movements of different cryptocurrencies, which can be used to manage risk and diversify portfolios.
The HIST endpoints, RV Volatility Cone, Term Structure Shadow, and Term Structure Shadow Compare, provide a historical perspective on volatility, enabling traders to better understand past market behavior.
API Endpoints
[LIVE] RV Percentiles Distribution UpDown
[LIVE] RV CloseToClose Parkinson
[HIST] Term Structure Shadow Compare
FAQs
What is Realized Volatility (RV)?
- Realized Volatility is a measure of how much the price of an asset, such as a cryptocurrency, has changed for a certain set of returns. Volatility is considered a statistical measure of dispersion about the average, regardless of the direction of the move.
Why are these RV endpoints useful?
- These endpoints offer granular insights into the volatility patterns of specific cryptocurrencies across various timeframes. They enable traders to better understand past market behavior, manage risk, and inform trading strategies.
What is the significance of the HIST endpoints?
- The HIST endpoints provide a historical perspective on volatility, offering insights into how volatility has evolved over time. Understanding the past behavior of volatility can help inform predictions about future volatility and guide risk management strategies.
How can RV be used in trading strategies?
- RV can be used to gauge the risk associated with a particular investment. High volatility indicates a higher degree of risk, but also a higher potential for reward. Understanding volatility can be particularly crucial for options pricing, as options premiums often increase during periods of high volatility. Understanding how volatility behaves can therefore help traders optimize their options trading strategies.
Sample Use Cases
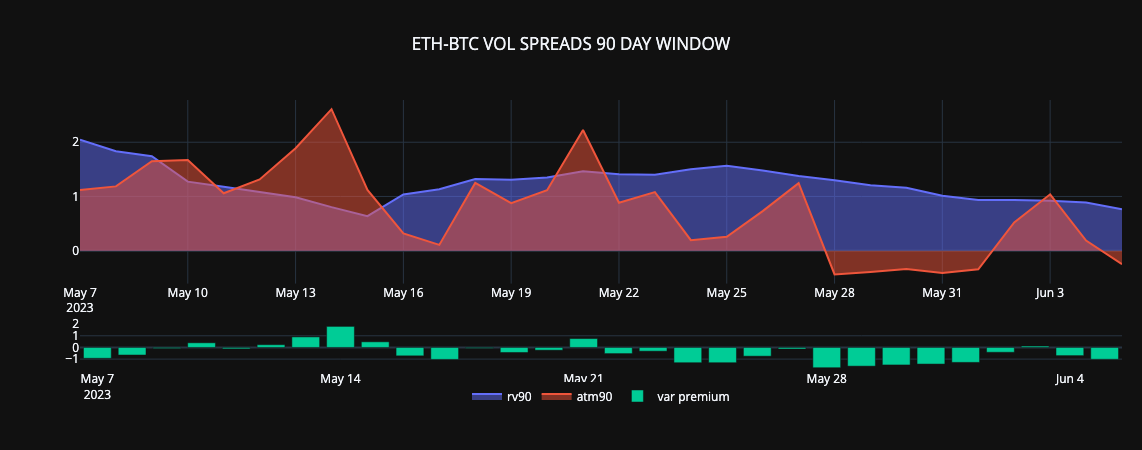
The comparison of Realized Volatility (RV) between Bitcoin and Ethereum can offer valuable insights for traders and investors in several ways:
-
Relative Risk Assessment
Comparing the RV of Bitcoin and Ethereum can give investors a clearer understanding of the relative risk associated with each cryptocurrency. If Bitcoin's RV is higher than Ethereum's, this could indicate that Bitcoin's price has been fluctuating more widely in the recent period, suggesting higher risk but also potentially higher returns. Conversely, if Ethereum's RV is higher, this would suggest that Ethereum carries a higher risk. -
Portfolio Diversification
The RV comparison between Bitcoin and Ethereum can also provide important information for diversification purposes. If the two cryptocurrencies exhibit similar volatility patterns, they may not provide substantial diversification benefits when combined in a portfolio. On the other hand, if their volatility patterns differ significantly, adding both to a portfolio could potentially enhance diversification and reduce overall portfolio risk. -
Trading Strategy Development
Traders could use RV comparisons between Bitcoin and Ethereum to inform trading strategies. For instance, if one cryptocurrency has a high RV and the other has a low RV, a trader could potentially profit from this discrepancy by implementing a volatility arbitrage strategy, going long on the option of the high-volatility cryptocurrency and short on the option of the low-volatility one.
https://github.com/genesis-volatility/gvol-py-notebooks/blob/main/LITE_Realized%20vs%20Implied.ipynb
https://github.com/genesis-volatility/gvol-py-notebooks/blob/main/LITE_Realized%20vs%20Implied.ipynb
Updated 2 months ago